Powerwave Technologies BDA1200 Bi-Directional Amplifier, Model BDA1200 User Manual Align

Powerwave Technologies Inc. Bi-Directional Amplifier, Model BDA1200 Align

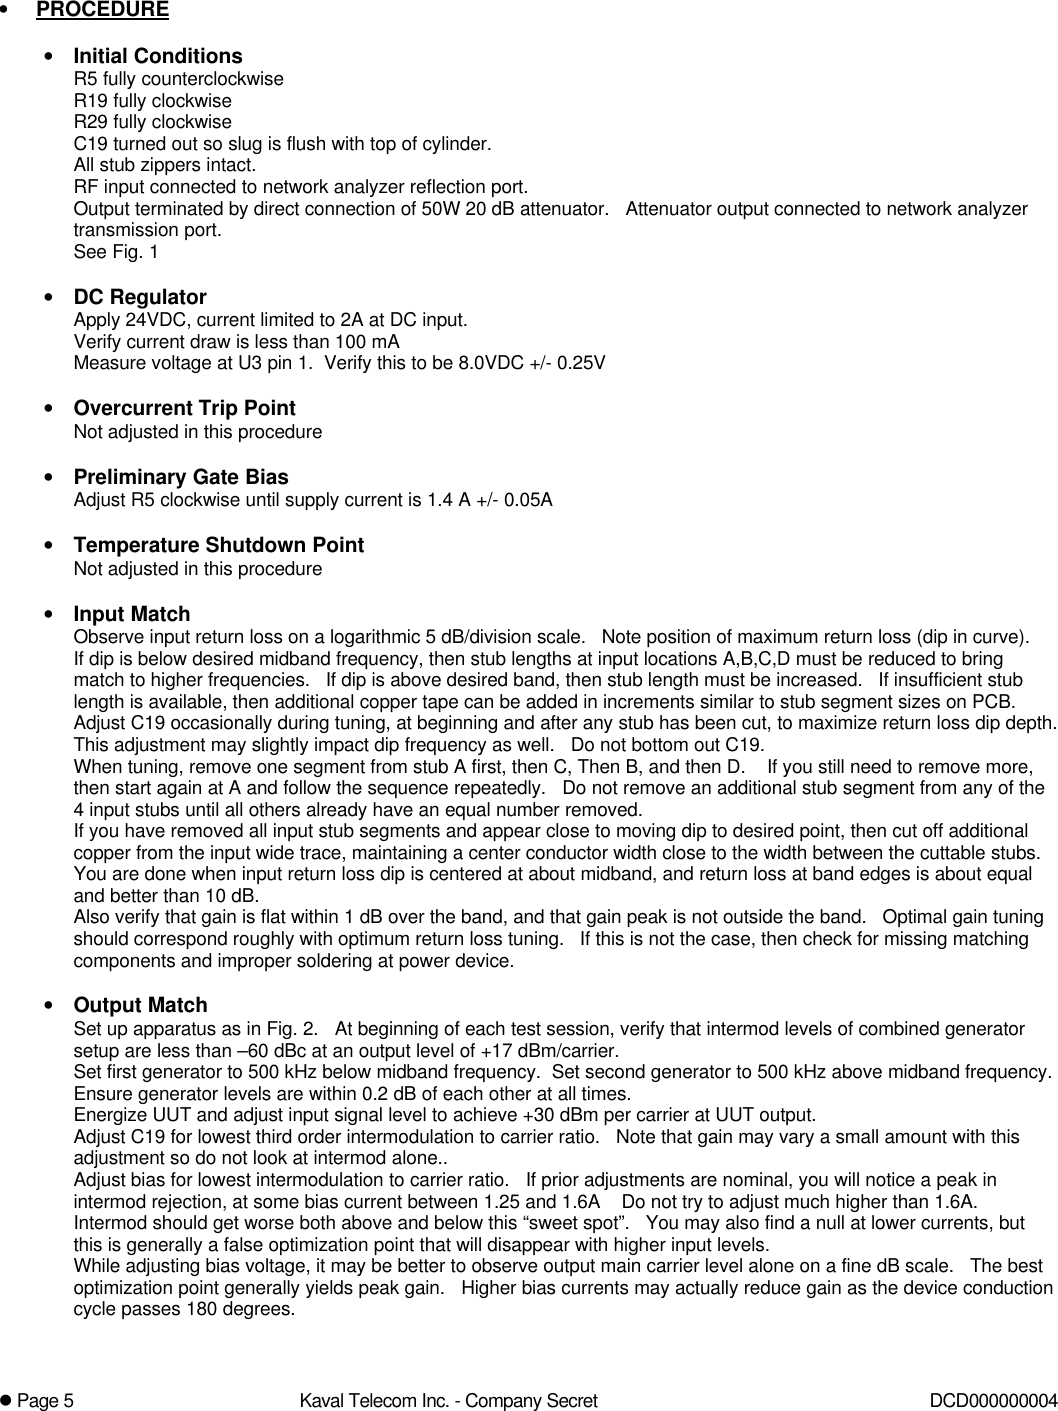
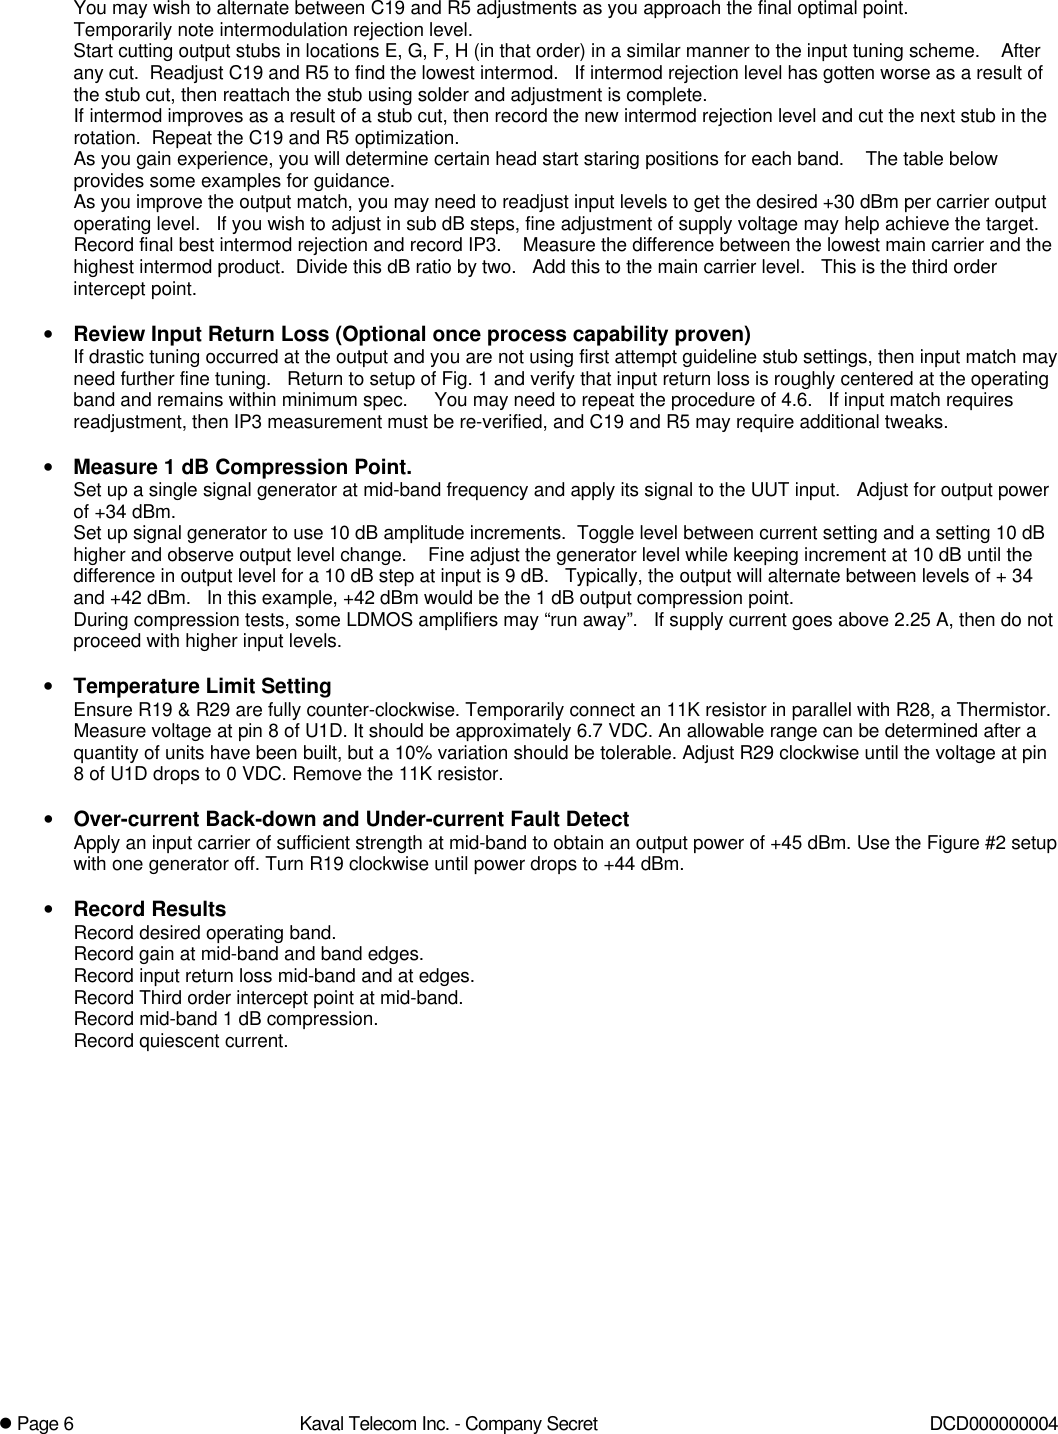
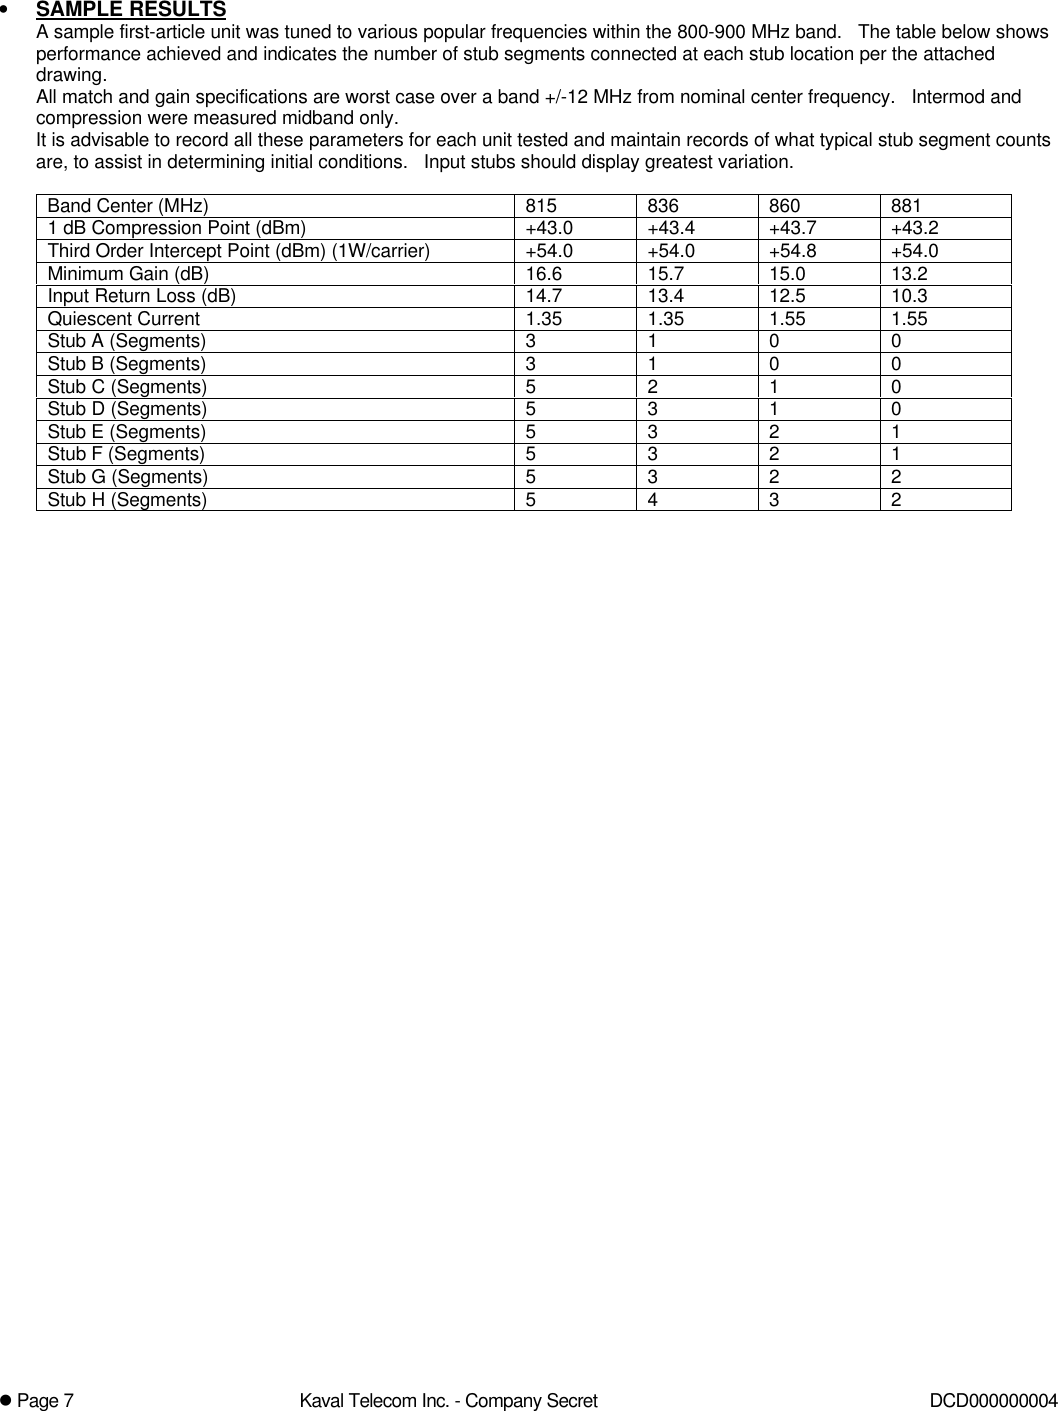
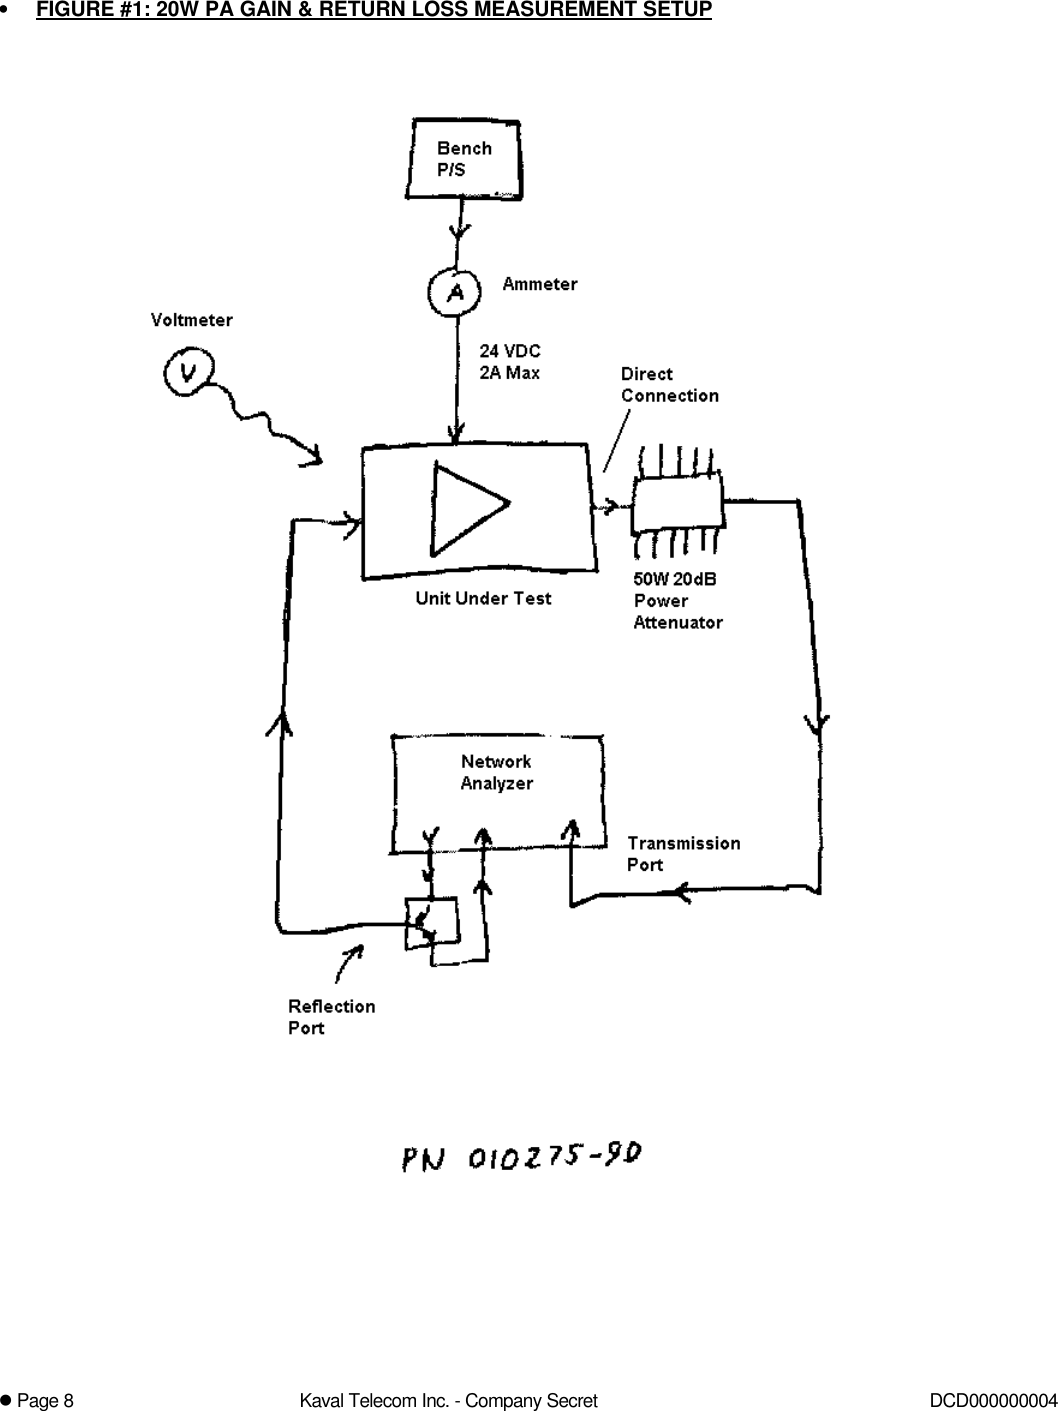
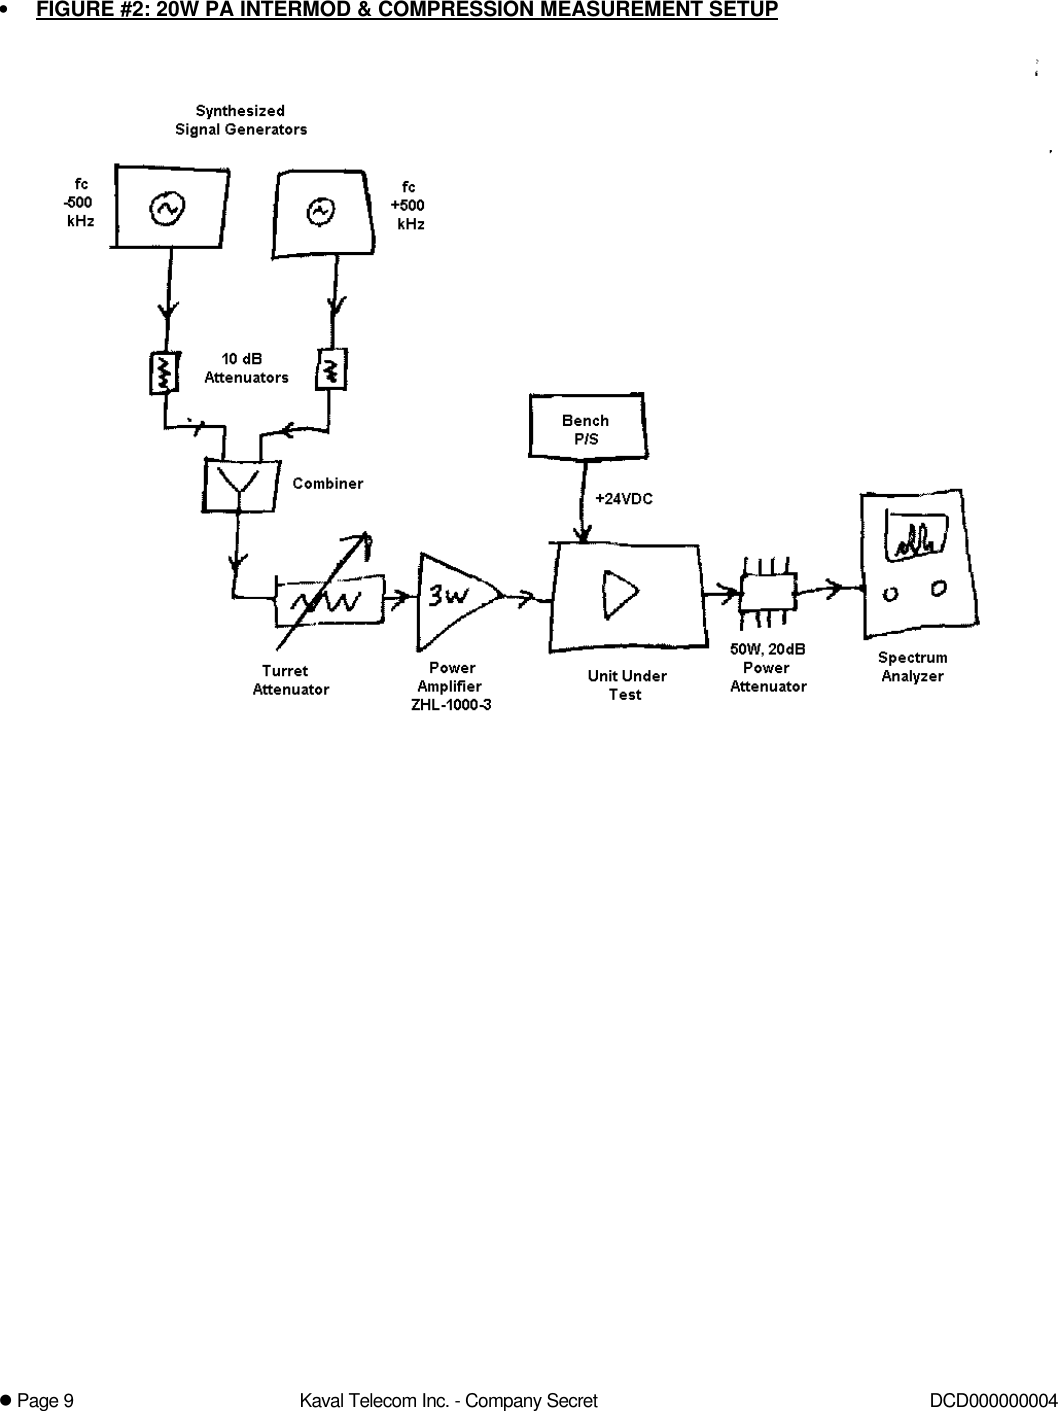
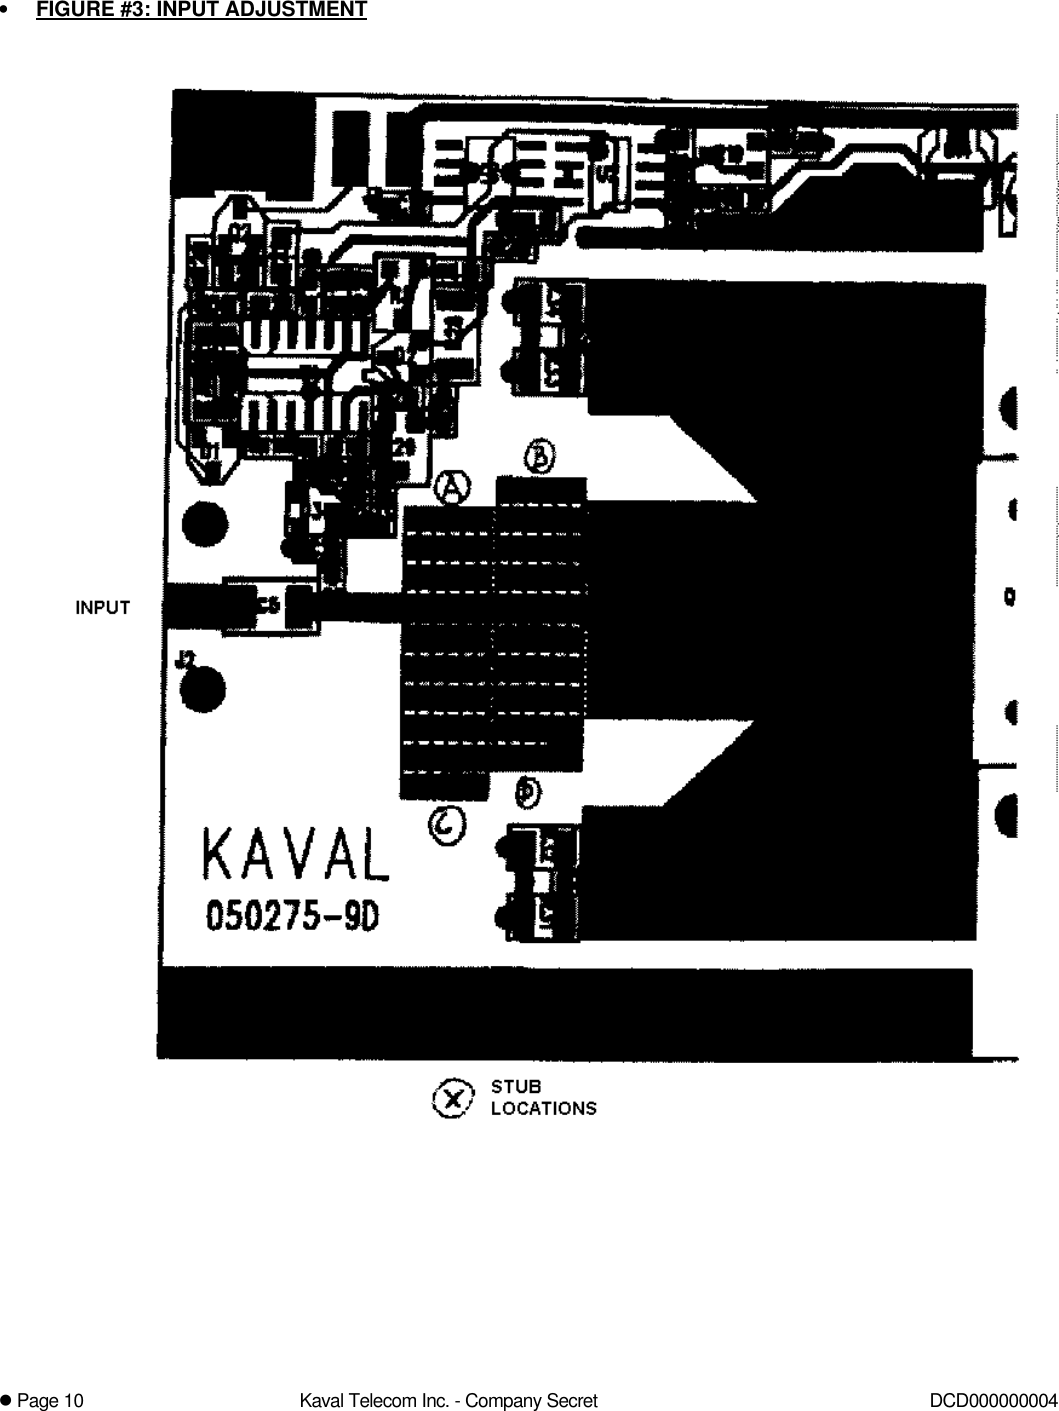
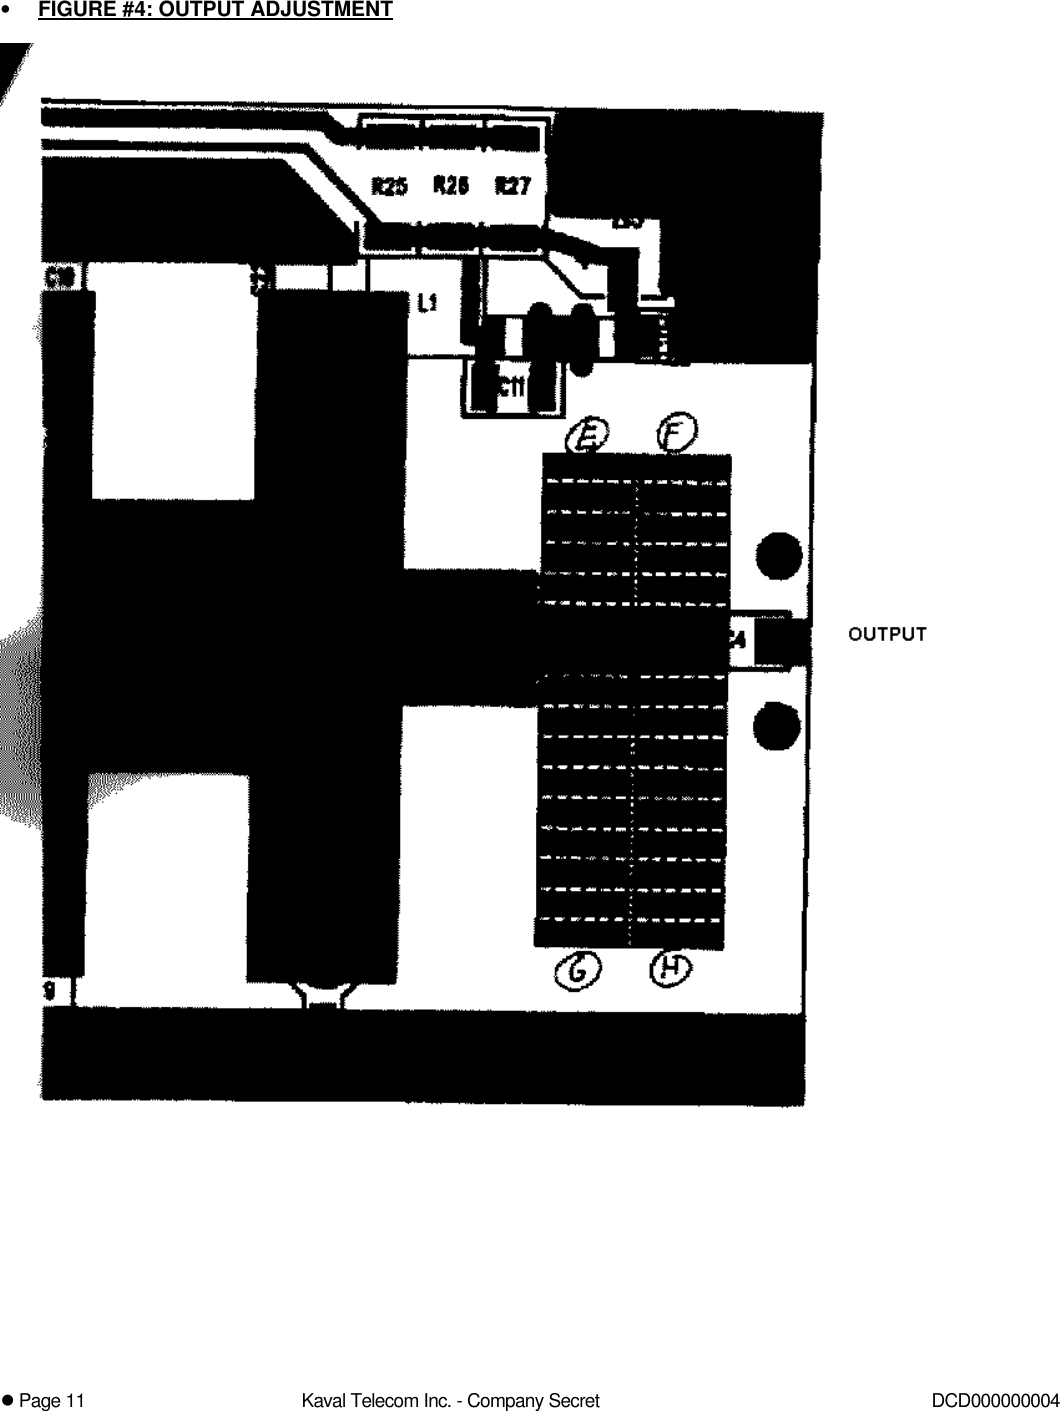
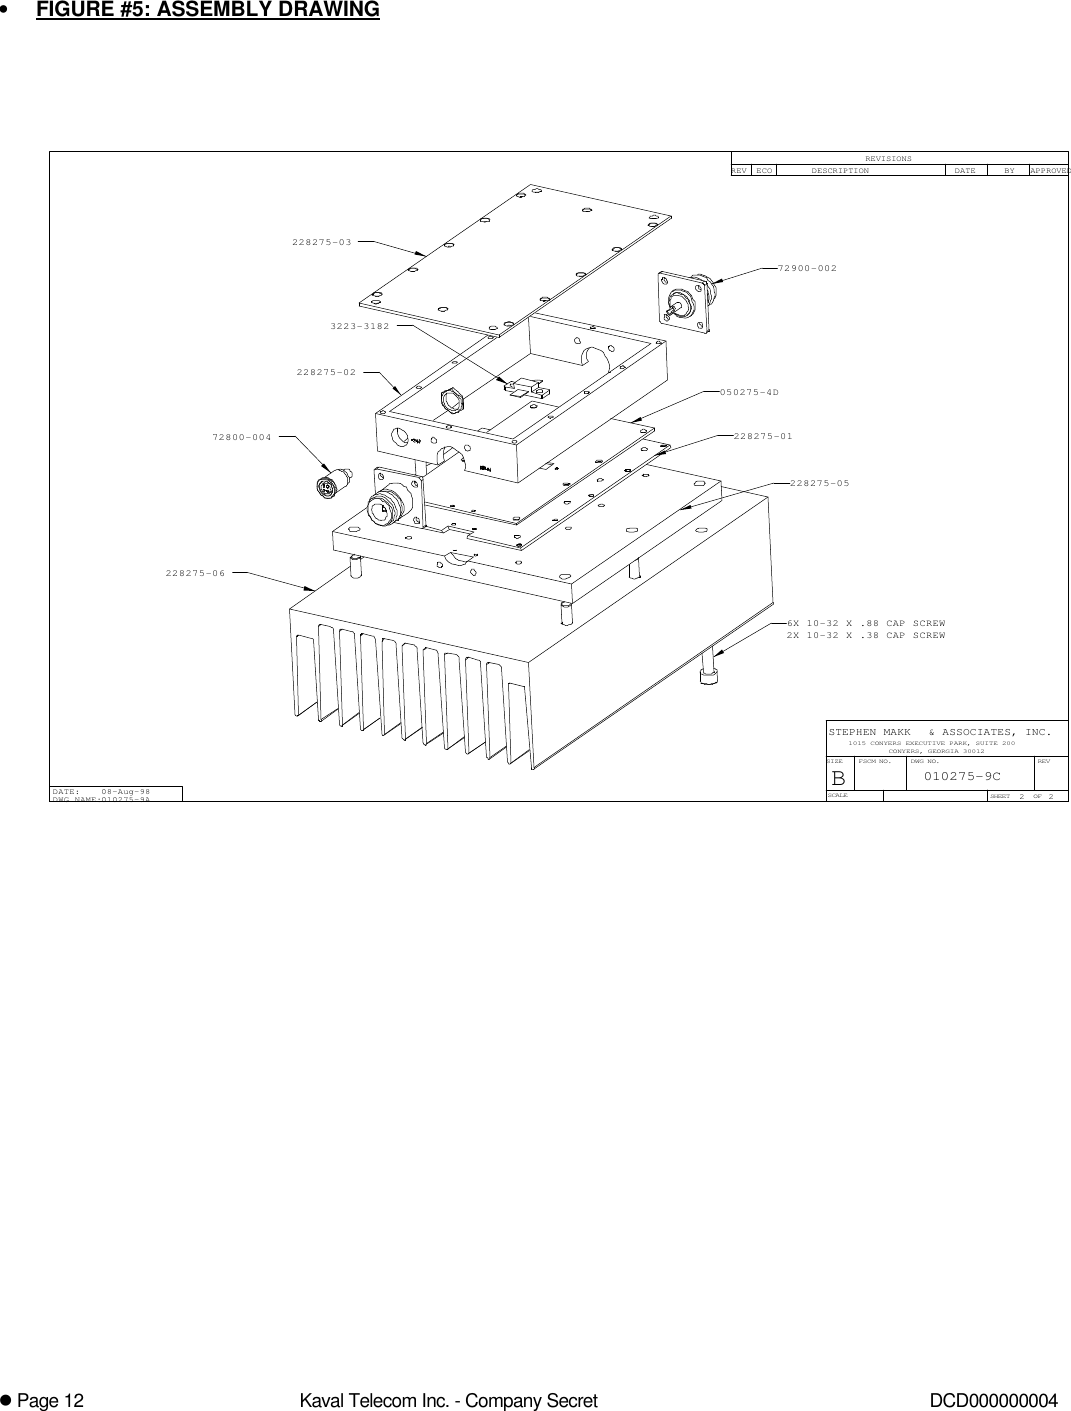
test and alignment for power amplifier

l Page 1Kaval Telecom Inc. - Company Secret DCT00000000460 GOUGH ROAD, MARKHAM, ONTARIO L3R 8X7Tel: (905) 940-1400 Toll Free: 888-86KAVAL Fax: (905) 946-3392TEST & ALIGNMENT SPECIFICATIONFOR BDA 800 MHz 20W PA (Power Amplifier)DCT000000004Revision 1, May 17, 1999TITLE SIGNATURE DATEOriginatorProduct Group Team LeaderMarketingAdministration
l Page 2Kaval Telecom Inc. - Company Secret DCD000000004TABLE OF CONTENTS•REVISION RECORD 3•PROPRIETARY NOTICE: 3•INTRODUCTION: 4•EQUIPMENT: 4•PROCEDURE 5•Initial Conditions 5•DC Regulator 5•Overcurrent Trip Point 5•Preliminary Gate Bias 5•Temperature Shutdown Point 5•Input Match 5•Output Match 5•Review Input Return Loss (Optional once process capability proven) 6•Measure 1 dB Compression Point. 6•Temperature Limit Setting 6•Over-current Back-down and Under-current Fault Detect 6•Record Results 6•SAMPLE RESULTS 7•FIGURE #1: 20W PA GAIN & RETURN LOSS MEASUREMENT SETUP 8•FIGURE #2: 20W PA INTERMOD & COMPRESSION MEASUREMENT SETUP 9•FIGURE #3: INPUT ADJUSTMENT 10•FIGURE #4: OUTPUT ADJUSTMENT 11•FIGURE #5: ASSEMBLY DRAWING 12
l Page 3Kaval Telecom Inc. - Company Secret DCD000000004• REVISION RECORDRevisions are tracked here as ...1May 17, 1999 Updated from SMA Documents Alan Aslett• PROPRIETARY NOTICE:This document contains restricted, proprietary, copyrighted information, ownership of which is retained by Kaval Telecom Inc.   Kaval Telecom Inc.’s express written consent is required prior to any  reproduction, implementation, publication or other use ofsuch information. This is a controlled document for internal company use only, and is to be distributed only to the parties listedin the Distribution List.  Technical information in this document may qualify for patent protection, and for this reason, “publicdisclosure”, as defined in applicable Patent Law is strictly forbidden except with the express written authorization of thePresident of Kaval Telecom Inc.This document is considered “Strategic Technical Information” by Kaval Telecom Inc.   All Kaval employee recipients mustmaintain confidentiality in accordance with Kaval Employee Confidentiality regulations per the Employee Manual.All contractors in possession of this information must maintain confidentiality in accordance with applicable Non-DisclosureAgreements and Product Development Agreements, but notwithstanding the preceding, shall, at a minimum, maintain at leastthe same level of confidentiality that they apply to their own confidential internal documents.
l Page 4Kaval Telecom Inc. - Company Secret DCD000000004• INTRODUCTION:The objective is to align variable elements in Kaval 20W 800-900 MHz power amps to optimize RF performance, and verifyperformance against specifications.   This procedure applies to amplifiers to be used together with external electronic faultmonitoring modules in Kaval BDA systems.   Certain internal fault detection features are not aligned in such case andthese adjustments are set to positions which defeat these functions.  Alignment of fault detection circuitry not necessary inBDA applications are covered in another document.The Kaval 20W power amplifier is a single stage Class AB linear power amplifier using a high power LDMOS amplifiertransistor.  Compression point is about 20W, and intermod performance rivals that of similar amplifiers with 30W ratings.This design is optimized for best intermodulation and minimum heat in multicarrier repeaters, not necessarily highest outputpower in saturation.  Due to the necessity of using microstrip matching elements at these frequencies, and the need to tunethe amplifier to various application bands, microstrip element lengths must be adjusted in some cases.    The PCB designincludes easily cuttable “zipper links” in the microstrip stubs which allows tuning using a hobby knife.  Care must be takenwhen cutting links that the entire link is removed.   A thin knife cut may leave copper slivers that may later reconnect anddetune the amp after exposure to vibration.   For this reason, use the wider back edge of the hobby or putty knife, andverify, using a magnifier, that the links are properly and permanently cut.  If during adjustment, it is found that one went toofar, and a link needs to be restored, this can be easily done by solder bridging.  At all times, do not apply power to UUTunless both input and output are properly RF terminated.    Be especially careful not to connect UUT with input and outputreversed since this unit has ample capability to destroy network or spectrum analyzers.• EQUIPMENT:The following equipment is needed for execution of this procedure.q Scalar Network analyzer, 1 GHz capable.  Analyzer must be normalized and calibrated per manufacturer’s instructionsprior to any test session and at 1 hour intervals thereafter.q Termination calibration kit for above (type N)q Spectrum Analyzer, 1 GHz capable, input dynamic range up to +25 dBm with input intermod < -60 dBcq 50W 20 dB Attenuator good to 1 GHz.  Type N.q Multimeterq 800-1000 MHz Splitter/Combiner, Isolation > 20 dB 800 MHz to 1000 MHz.  (Narda 4322-2 or equivalent)q Two 10 dB fixed attenuatorsq Turret Attenuator with 1 dB resolution.   0-30 dB minimum range.q Broadband Linear Power Amplifier, 3W, 800-100 MHz,  (Mini-Circuits ZHL-1000-3W or equivalent.)q Two synthesized signal generators capable of tuning over 800-900 MHz band with output capability of +5 dBmminimum.q Johanson capacitor trimming tool No. 8777q Power supply cable with male Framatome “Jupiter” connector.q DC Power supply capable of 2A at 24 VDC with variable current limiting.q Customized Amplifier top cover with access holes drilled for access to C19 and R5q Toggle press or other means for temporarily securing amplifier top lid during test.  (You may use 4 screws in thecorners as an alternative.q RF interconnection cables as required.   Do not use between series adaptors between network analyzer and UUT RFinput or between UUT RF output and high power attenuator.Note, for accurate output level measurements, be sure to offset any cable losses or attenuator variations from the outputreading.    Output losses should be characterized to within 0.1 dB.
l Page 5Kaval Telecom Inc. - Company Secret DCD000000004• PROCEDURE• Initial ConditionsR5 fully counterclockwiseR19 fully clockwiseR29 fully clockwiseC19 turned out so slug is flush with top of cylinder.All stub zippers intact.RF input connected to network analyzer reflection port.Output terminated by direct connection of 50W 20 dB attenuator.   Attenuator output connected to network analyzertransmission port.See Fig. 1• DC RegulatorApply 24VDC, current limited to 2A at DC input.Verify current draw is less than 100 mAMeasure voltage at U3 pin 1.  Verify this to be 8.0VDC +/- 0.25V• Overcurrent Trip PointNot adjusted in this procedure• Preliminary Gate BiasAdjust R5 clockwise until supply current is 1.4 A +/- 0.05A• Temperature Shutdown PointNot adjusted in this procedure• Input MatchObserve input return loss on a logarithmic 5 dB/division scale.   Note position of maximum return loss (dip in curve).If dip is below desired midband frequency, then stub lengths at input locations A,B,C,D must be reduced to bringmatch to higher frequencies.   If dip is above desired band, then stub length must be increased.   If insufficient stublength is available, then additional copper tape can be added in increments similar to stub segment sizes on PCB.Adjust C19 occasionally during tuning, at beginning and after any stub has been cut, to maximize return loss dip depth.This adjustment may slightly impact dip frequency as well.   Do not bottom out C19.When tuning, remove one segment from stub A first, then C, Then B, and then D.    If you still need to remove more,then start again at A and follow the sequence repeatedly.   Do not remove an additional stub segment from any of the4 input stubs until all others already have an equal number removed.If you have removed all input stub segments and appear close to moving dip to desired point, then cut off additionalcopper from the input wide trace, maintaining a center conductor width close to the width between the cuttable stubs.You are done when input return loss dip is centered at about midband, and return loss at band edges is about equaland better than 10 dB.Also verify that gain is flat within 1 dB over the band, and that gain peak is not outside the band.   Optimal gain tuningshould correspond roughly with optimum return loss tuning.   If this is not the case, then check for missing matchingcomponents and improper soldering at power device.• Output MatchSet up apparatus as in Fig. 2.   At beginning of each test session, verify that intermod levels of combined generatorsetup are less than –60 dBc at an output level of +17 dBm/carrier.Set first generator to 500 kHz below midband frequency.  Set second generator to 500 kHz above midband frequency.Ensure generator levels are within 0.2 dB of each other at all times.Energize UUT and adjust input signal level to achieve +30 dBm per carrier at UUT output.Adjust C19 for lowest third order intermodulation to carrier ratio.   Note that gain may vary a small amount with thisadjustment so do not look at intermod alone..Adjust bias for lowest intermodulation to carrier ratio.   If prior adjustments are nominal, you will notice a peak inintermod rejection, at some bias current between 1.25 and 1.6A    Do not try to adjust much higher than 1.6A.Intermod should get worse both above and below this “sweet spot”.   You may also find a null at lower currents, butthis is generally a false optimization point that will disappear with higher input levels.While adjusting bias voltage, it may be better to observe output main carrier level alone on a fine dB scale.   The bestoptimization point generally yields peak gain.   Higher bias currents may actually reduce gain as the device conductioncycle passes 180 degrees.
l Page 6Kaval Telecom Inc. - Company Secret DCD000000004You may wish to alternate between C19 and R5 adjustments as you approach the final optimal point.Temporarily note intermodulation rejection level.Start cutting output stubs in locations E, G, F, H (in that order) in a similar manner to the input tuning scheme.    Afterany cut.  Readjust C19 and R5 to find the lowest intermod.   If intermod rejection level has gotten worse as a result ofthe stub cut, then reattach the stub using solder and adjustment is complete.If intermod improves as a result of a stub cut, then record the new intermod rejection level and cut the next stub in therotation.  Repeat the C19 and R5 optimization.As you gain experience, you will determine certain head start staring positions for each band.    The table belowprovides some examples for guidance.As you improve the output match, you may need to readjust input levels to get the desired +30 dBm per carrier outputoperating level.   If you wish to adjust in sub dB steps, fine adjustment of supply voltage may help achieve the target.Record final best intermod rejection and record IP3.    Measure the difference between the lowest main carrier and thehighest intermod product.  Divide this dB ratio by two.   Add this to the main carrier level.   This is the third orderintercept point.• Review Input Return Loss (Optional once process capability proven)If drastic tuning occurred at the output and you are not using first attempt guideline stub settings, then input match mayneed further fine tuning.   Return to setup of Fig. 1 and verify that input return loss is roughly centered at the operatingband and remains within minimum spec.     You may need to repeat the procedure of 4.6.   If input match requiresreadjustment, then IP3 measurement must be re-verified, and C19 and R5 may require additional tweaks.• Measure 1 dB Compression Point.Set up a single signal generator at mid-band frequency and apply its signal to the UUT input.   Adjust for output powerof +34 dBm.Set up signal generator to use 10 dB amplitude increments.  Toggle level between current setting and a setting 10 dBhigher and observe output level change.    Fine adjust the generator level while keeping increment at 10 dB until thedifference in output level for a 10 dB step at input is 9 dB.   Typically, the output will alternate between levels of + 34and +42 dBm.   In this example, +42 dBm would be the 1 dB output compression point.During compression tests, some LDMOS amplifiers may “run away”.   If supply current goes above 2.25 A, then do notproceed with higher input levels.• Temperature Limit SettingEnsure R19 & R29 are fully counter-clockwise. Temporarily connect an 11K resistor in parallel with R28, a Thermistor.Measure voltage at pin 8 of U1D. It should be approximately 6.7 VDC. An allowable range can be determined after aquantity of units have been built, but a 10% variation should be tolerable. Adjust R29 clockwise until the voltage at pin8 of U1D drops to 0 VDC. Remove the 11K resistor.• Over-current Back-down and Under-current Fault DetectApply an input carrier of sufficient strength at mid-band to obtain an output power of +45 dBm. Use the Figure #2 setupwith one generator off. Turn R19 clockwise until power drops to +44 dBm.• Record ResultsRecord desired operating band.Record gain at mid-band and band edges.Record input return loss mid-band and at edges.Record Third order intercept point at mid-band.Record mid-band 1 dB compression.Record quiescent current.
l Page 7Kaval Telecom Inc. - Company Secret DCD000000004• SAMPLE RESULTSA sample first-article unit was tuned to various popular frequencies within the 800-900 MHz band.   The table below showsperformance achieved and indicates the number of stub segments connected at each stub location per the attacheddrawing.All match and gain specifications are worst case over a band +/-12 MHz from nominal center frequency.   Intermod andcompression were measured midband only.It is advisable to record all these parameters for each unit tested and maintain records of what typical stub segment countsare, to assist in determining initial conditions.   Input stubs should display greatest variation.Band Center (MHz) 815 836 860 8811 dB Compression Point (dBm) +43.0 +43.4 +43.7 +43.2Third Order Intercept Point (dBm) (1W/carrier) +54.0 +54.0 +54.8 +54.0Minimum Gain (dB) 16.6 15.7 15.0 13.2Input Return Loss (dB) 14.7 13.4 12.5 10.3Quiescent Current 1.35 1.35 1.55 1.55Stub A (Segments) 3 1 0 0Stub B (Segments) 3 1 0 0Stub C (Segments) 5 2 1 0Stub D (Segments) 5 3 1 0Stub E (Segments) 5 3 2 1Stub F (Segments) 5 3 2 1Stub G (Segments) 5 3 2 2Stub H (Segments) 5 4 3 2
l Page 8Kaval Telecom Inc. - Company Secret DCD000000004• FIGURE #1: 20W PA GAIN & RETURN LOSS MEASUREMENT SETUP
l Page 9Kaval Telecom Inc. - Company Secret DCD000000004• FIGURE #2: 20W PA INTERMOD & COMPRESSION MEASUREMENT SETUP
l Page 10 Kaval Telecom Inc. - Company Secret DCD000000004• FIGURE #3: INPUT ADJUSTMENT
l Page 11 Kaval Telecom Inc. - Company Secret DCD000000004• FIGURE #4: OUTPUT ADJUSTMENT
l Page 12 Kaval Telecom Inc. - Company Secret DCD000000004• FIGURE #5: ASSEMBLY DRAWING2X 10-32 X .38 CAP SCREW6X 10-32 X .88 CAP SCREW3223-318272900-002050275-4D228275-01228275-05228275-0672800-004228275-02228275-03010275-9C22010275-9ADWG NAME:08-Aug-98DATE:CONYERS, GEORGIA 300121015 CONYERS EXECUTIVE PARK, SUITE 200& ASSOCIATES, INC.STEPHEN MAKK   OF  APPROVEDBYDATEREVISIONSECOREV DESCRIPTIONBREVFSCM NO. DWG NO.SHEETSCALESIZE

Navigation menu