Electronic Controls Design E47-6342-45 MEGA M.O.L.E. User Manual A47 6342 00 2 10
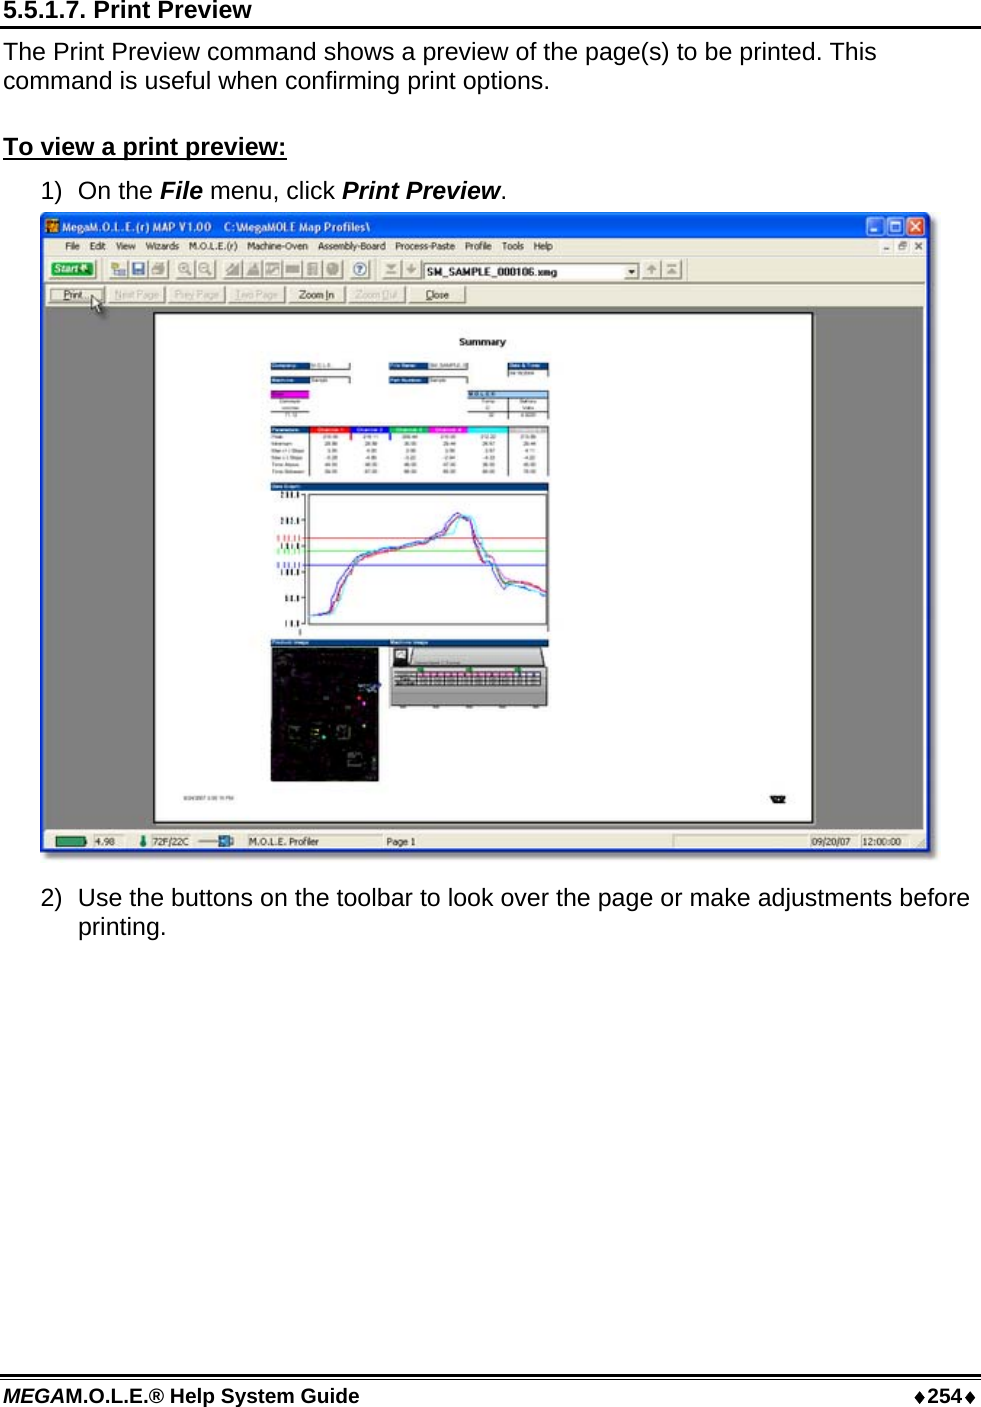
Electronic Controls Design Inc MEGA M.O.L.E. A47 6342 00 2 10
Contents
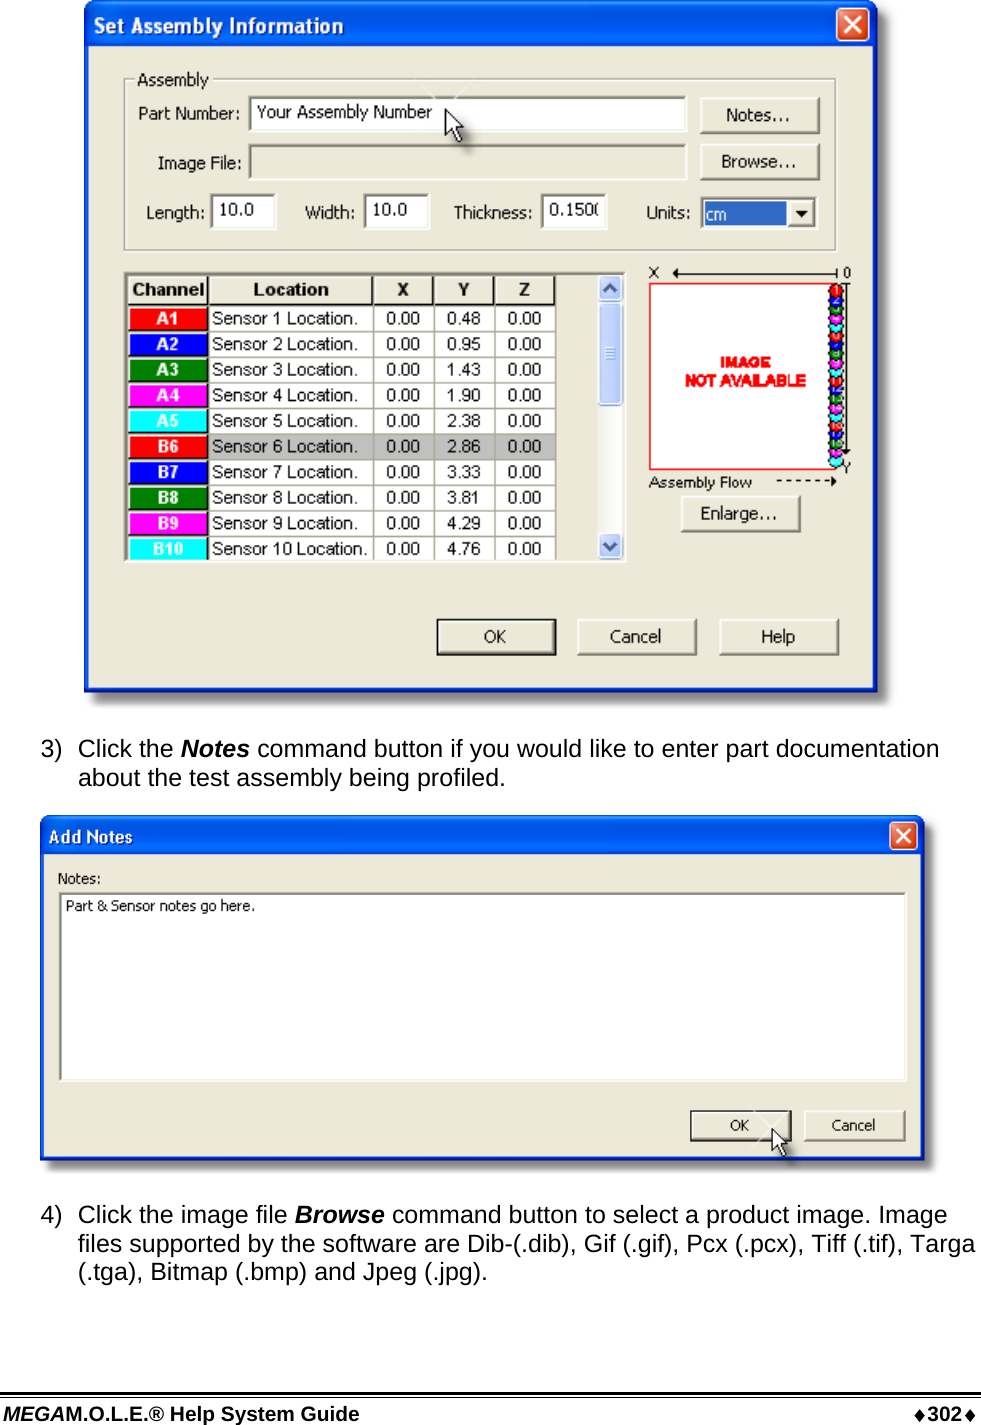
- 1. Quick Reference Guide
- 2. User Manual part 1
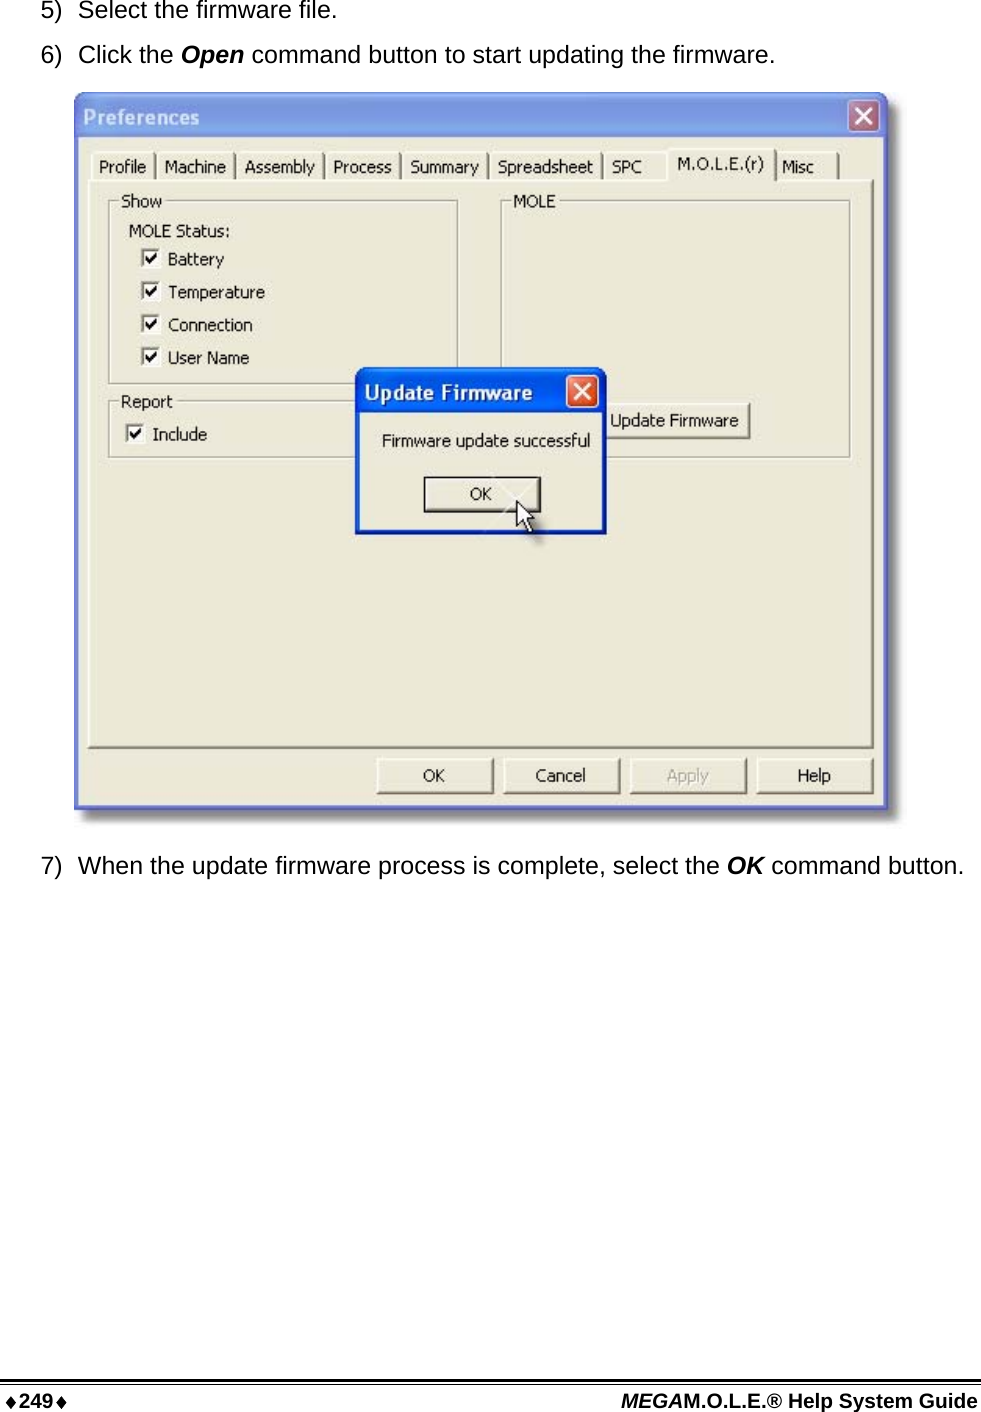
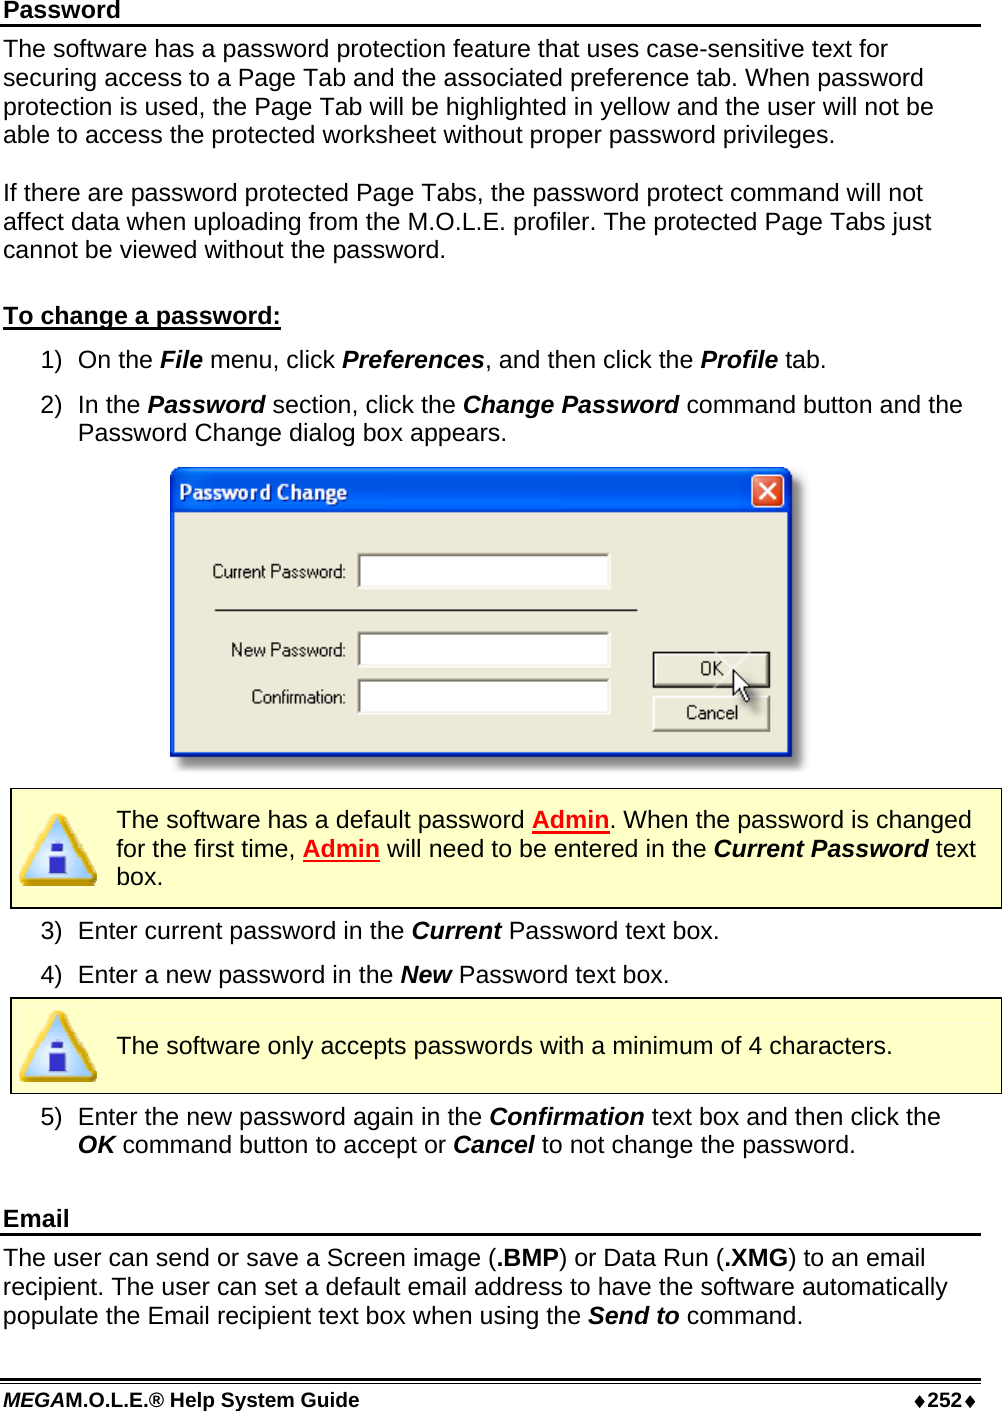
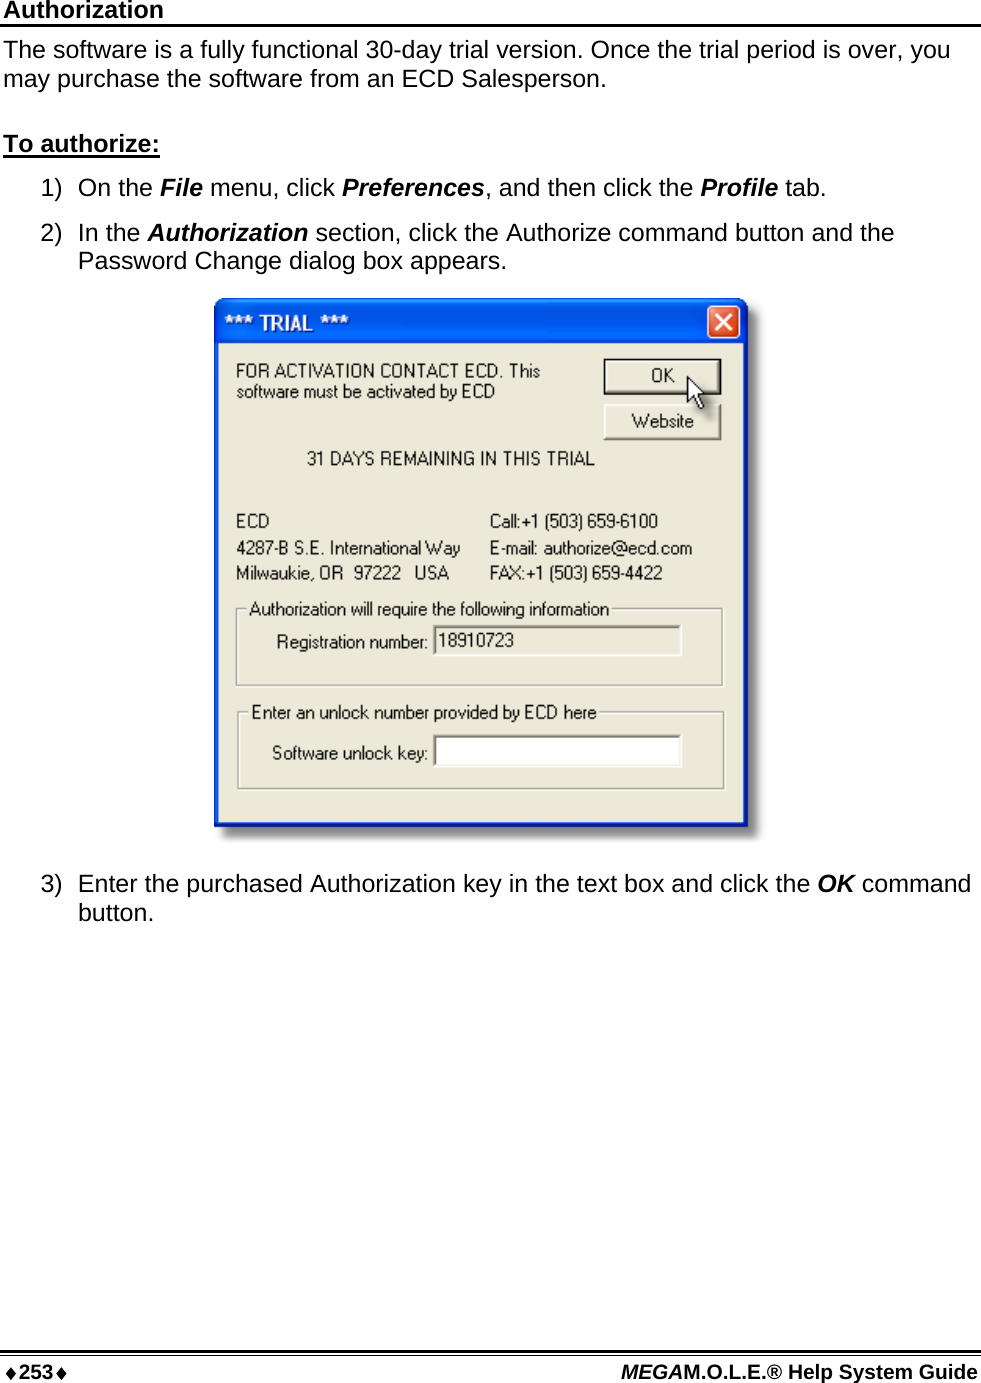
- 3. User Manual part 2
- 4. User Manual part 3
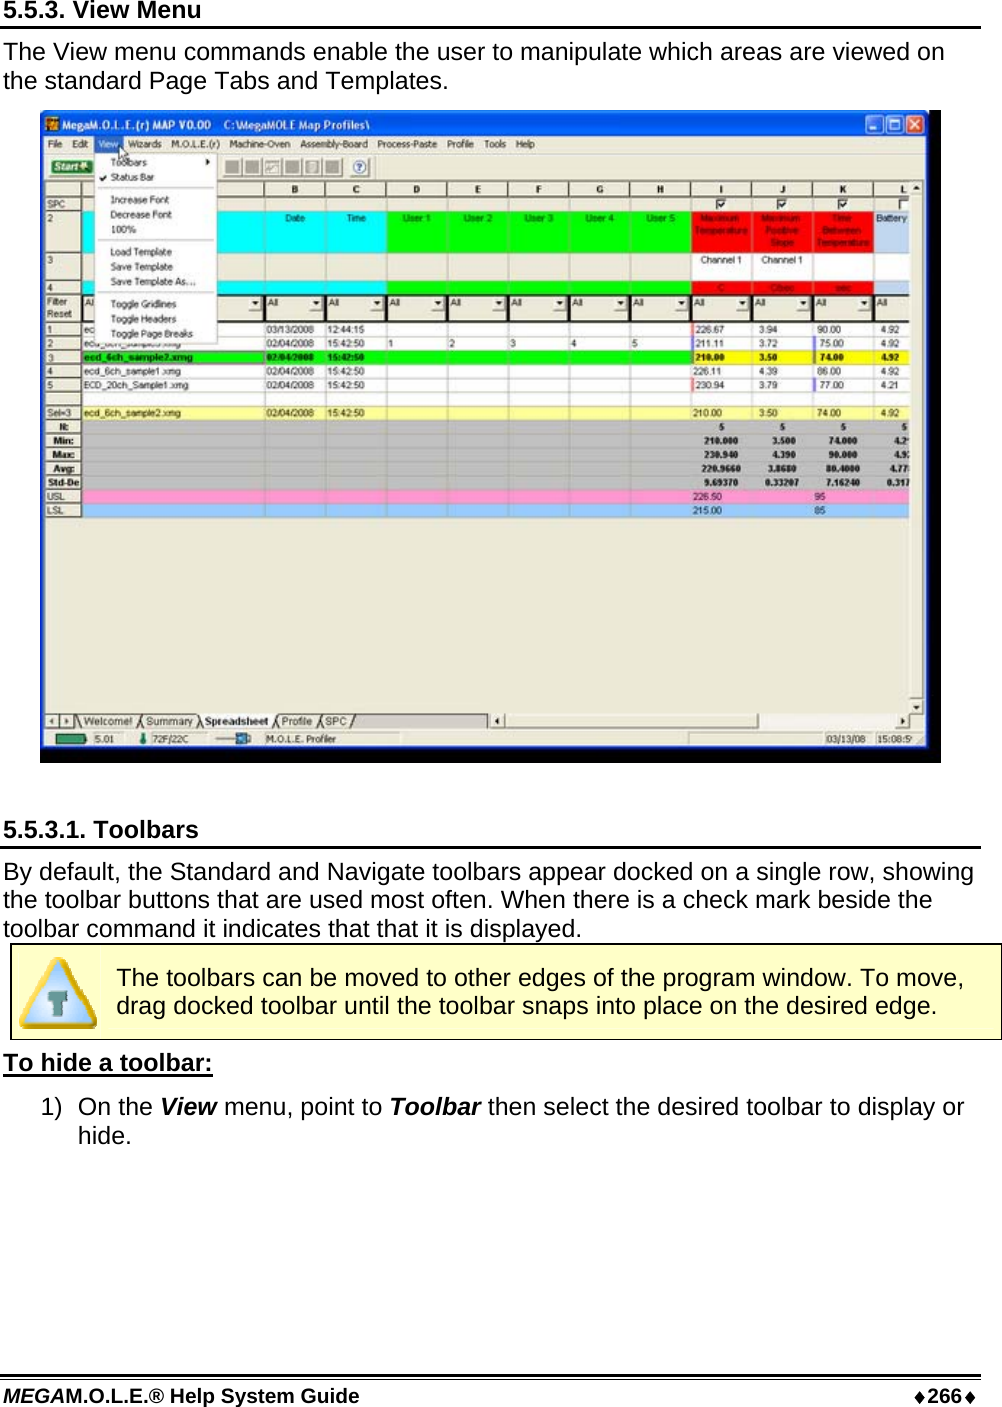
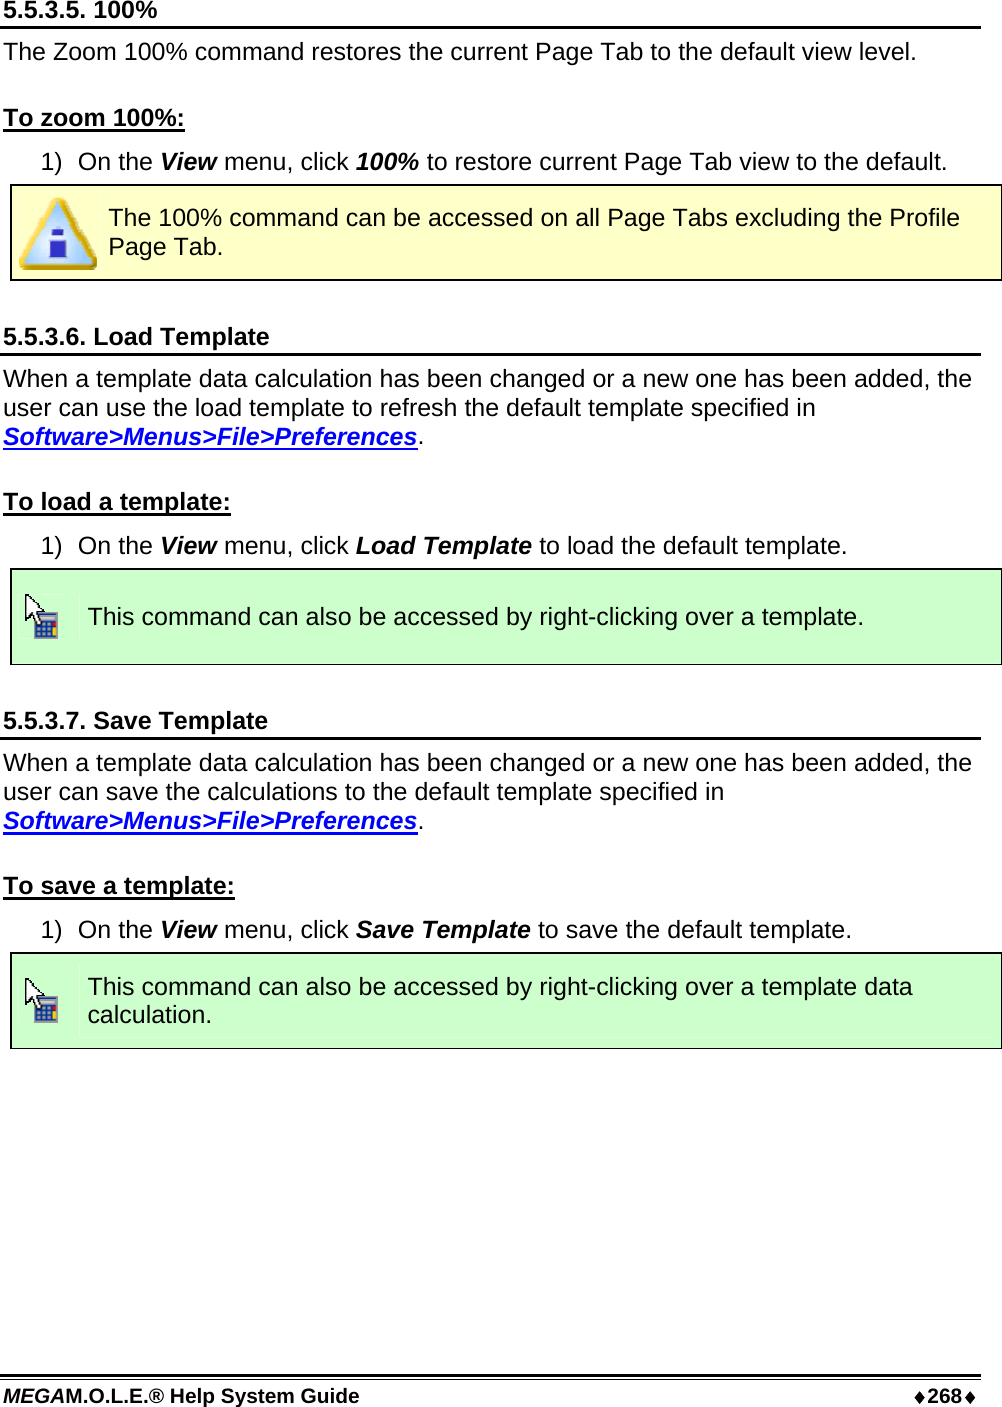
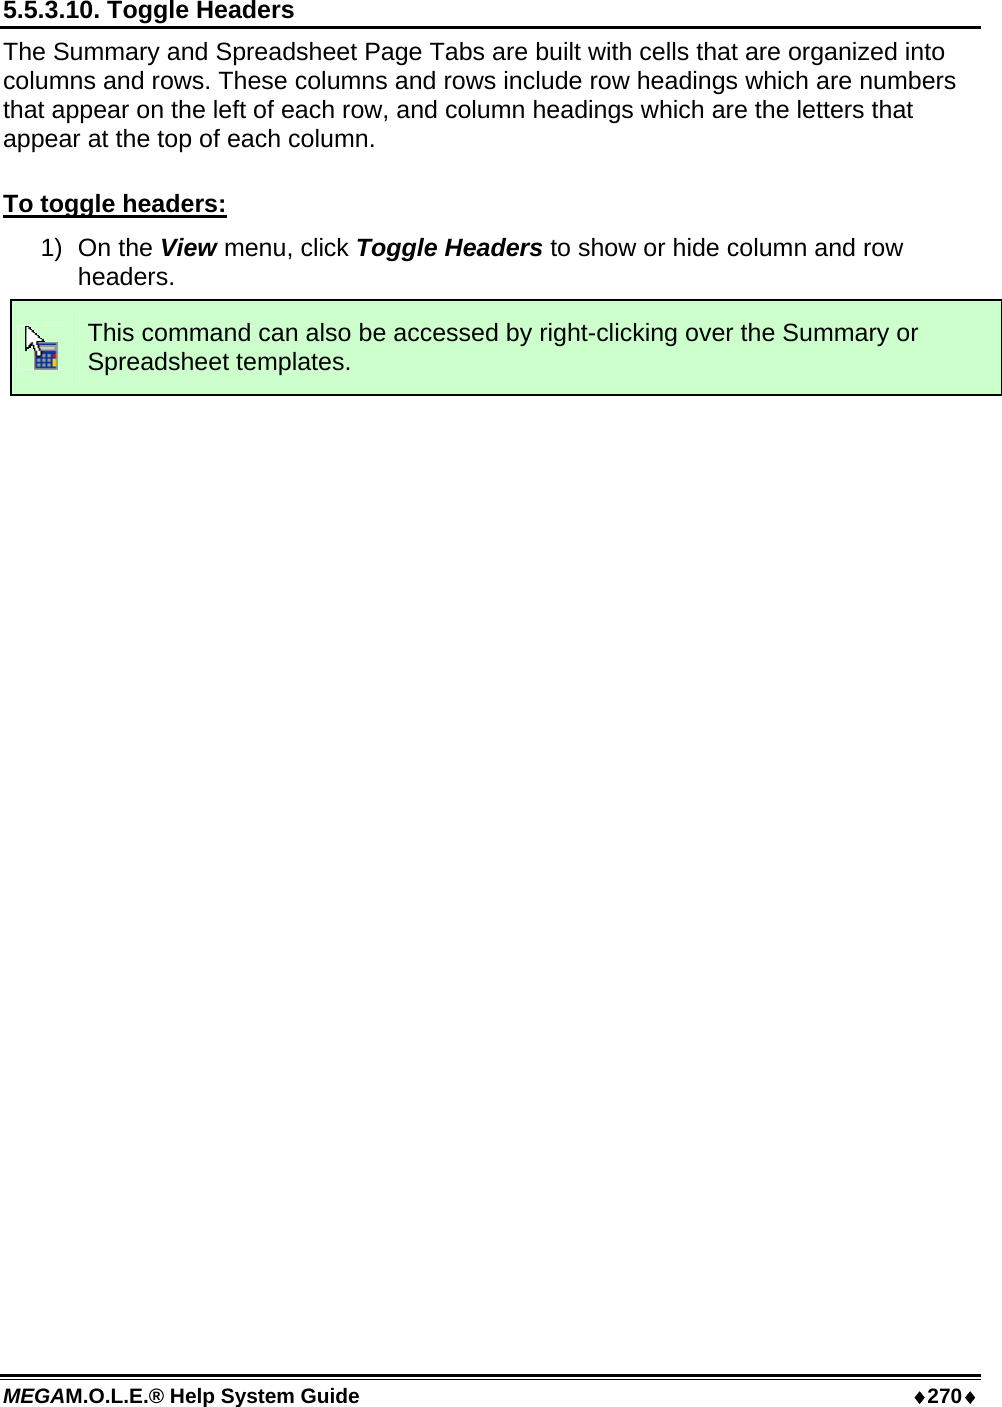
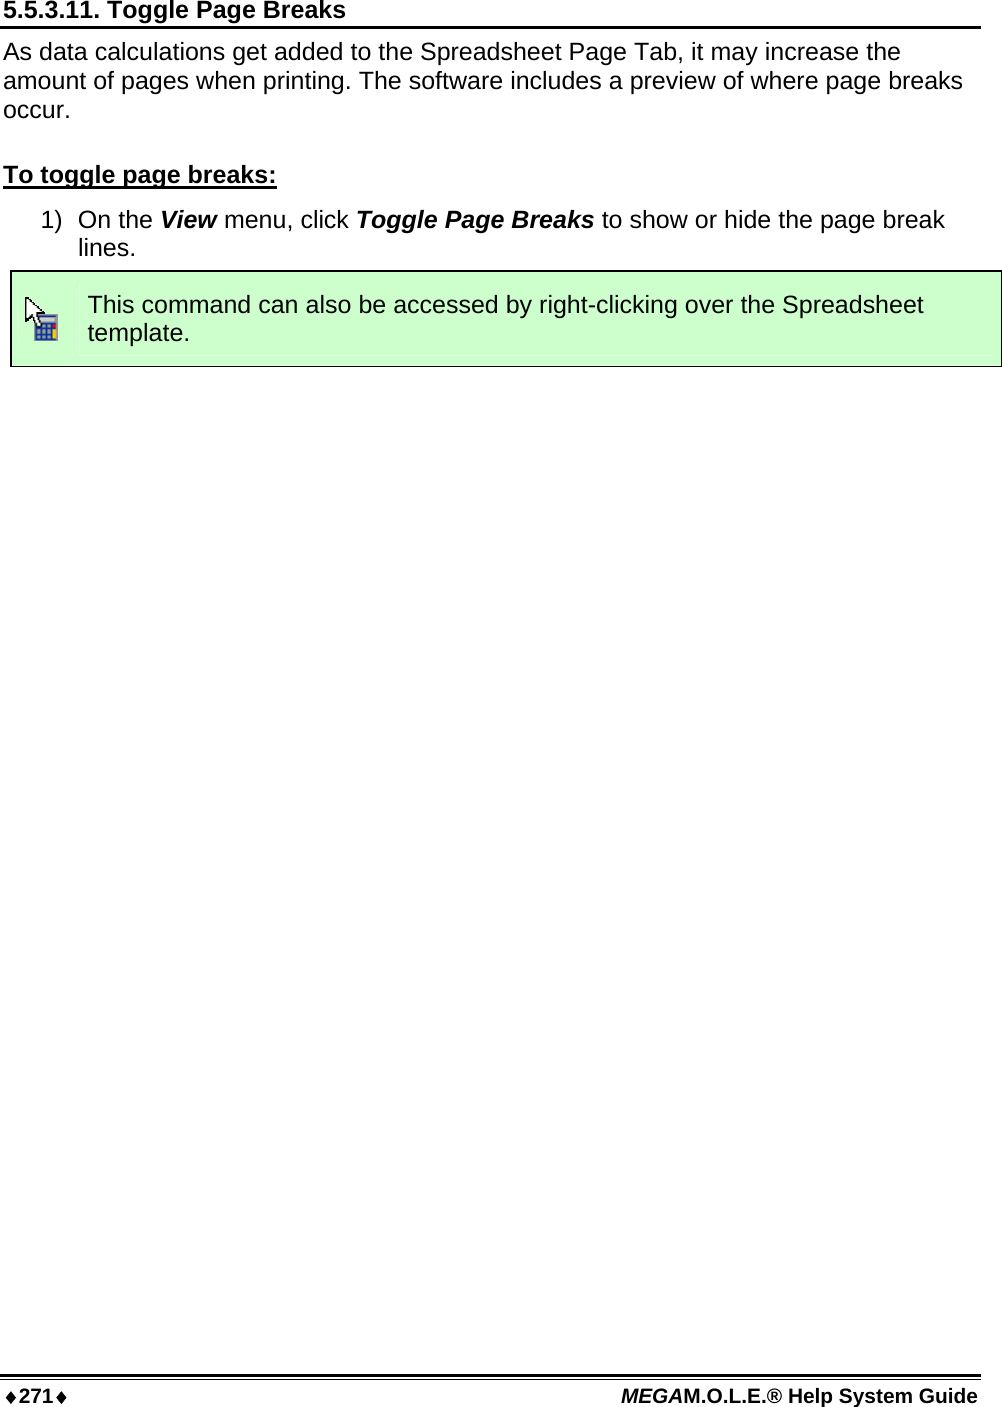
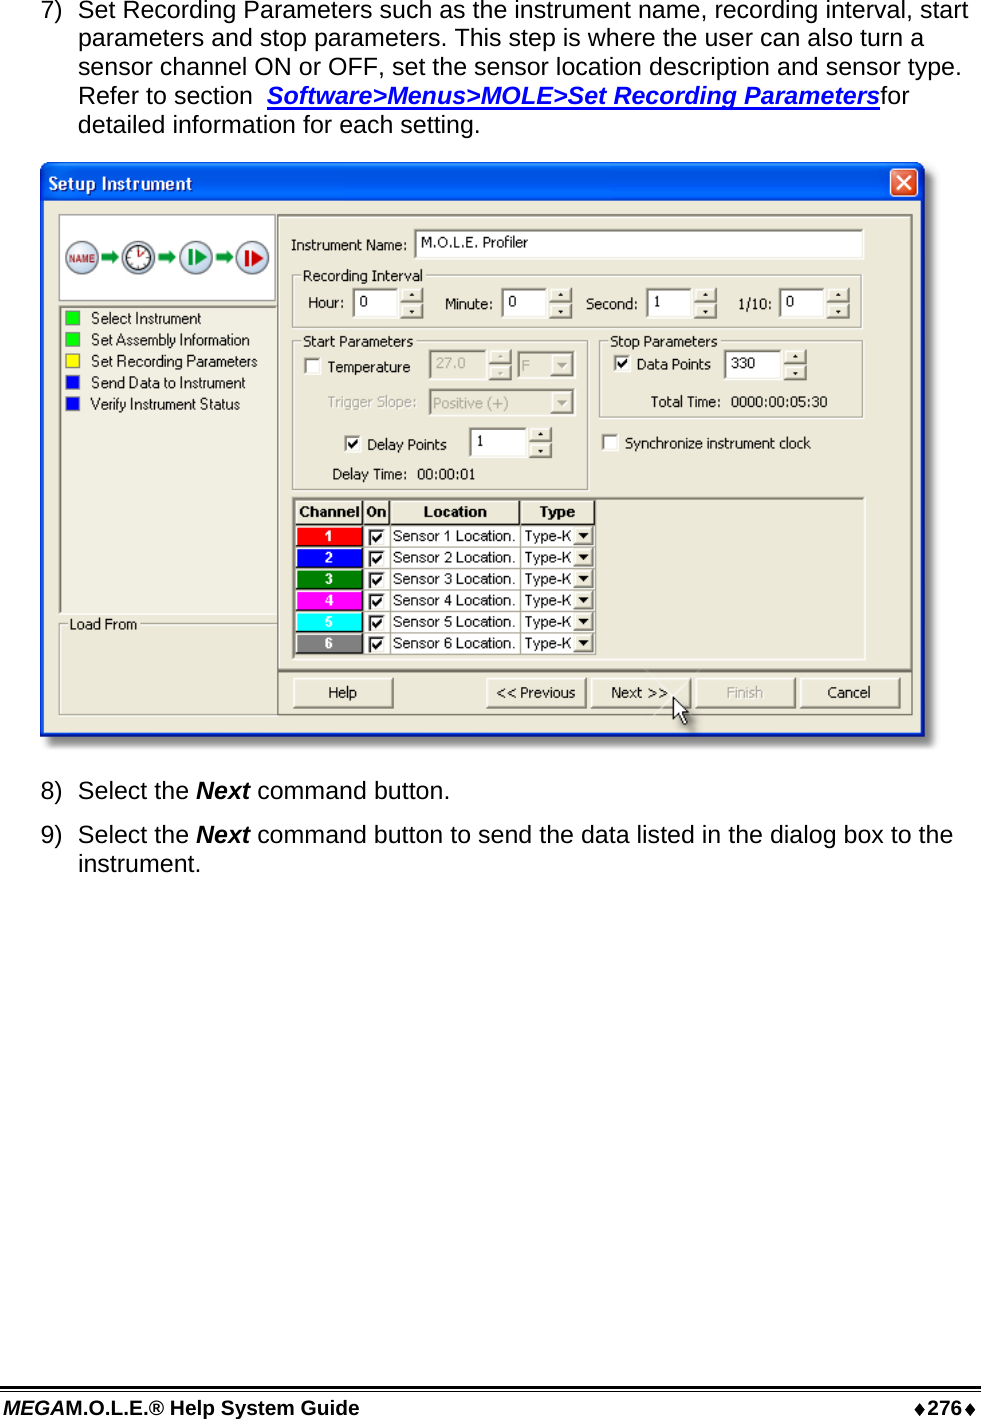
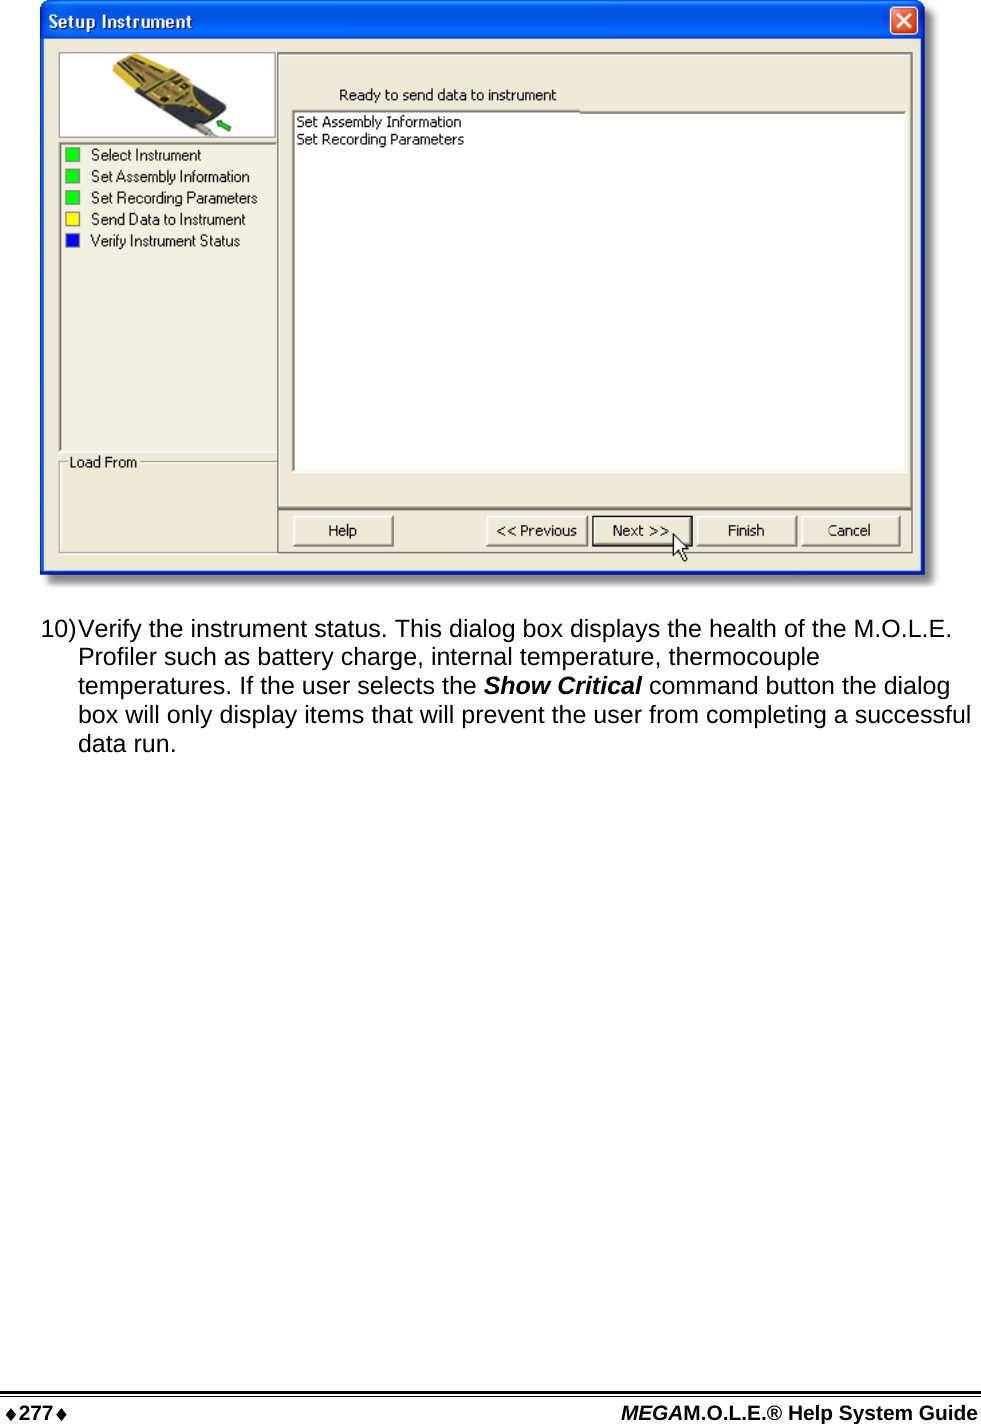
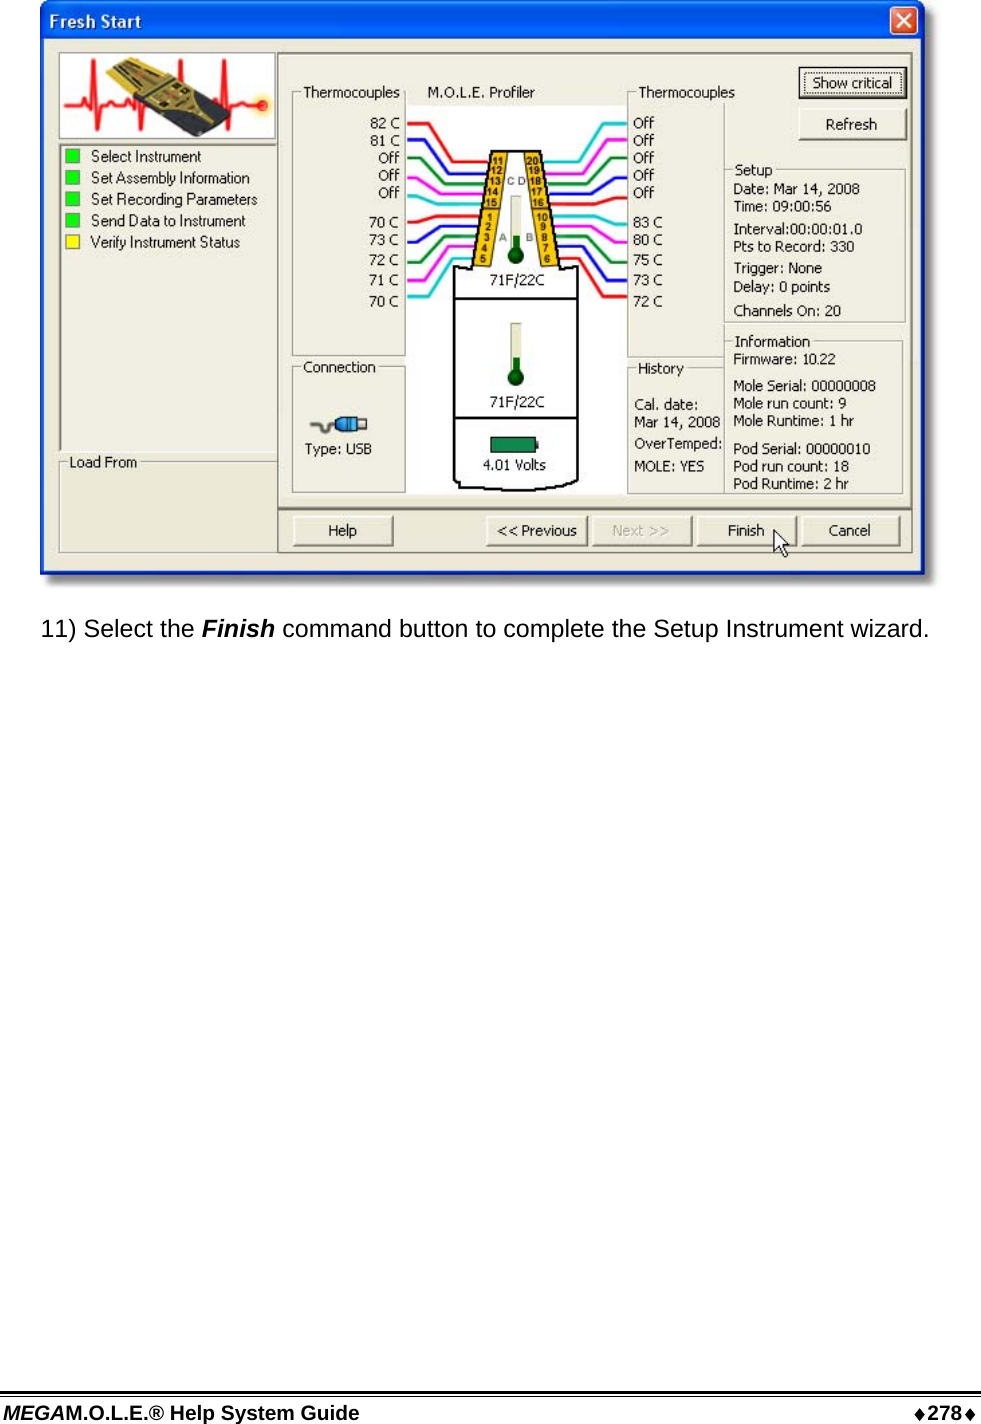
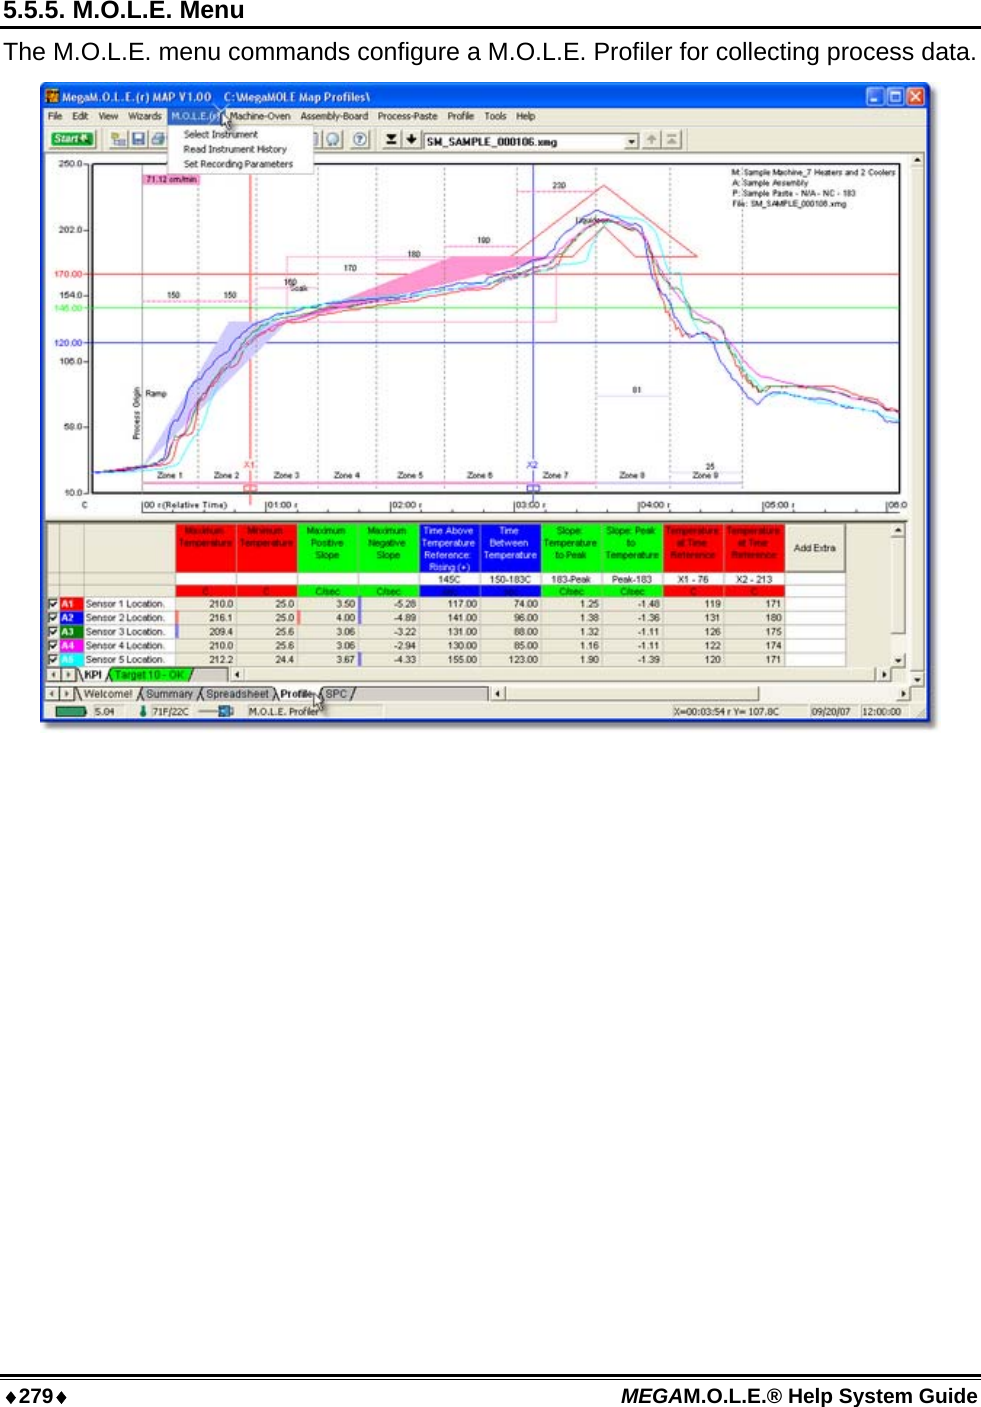
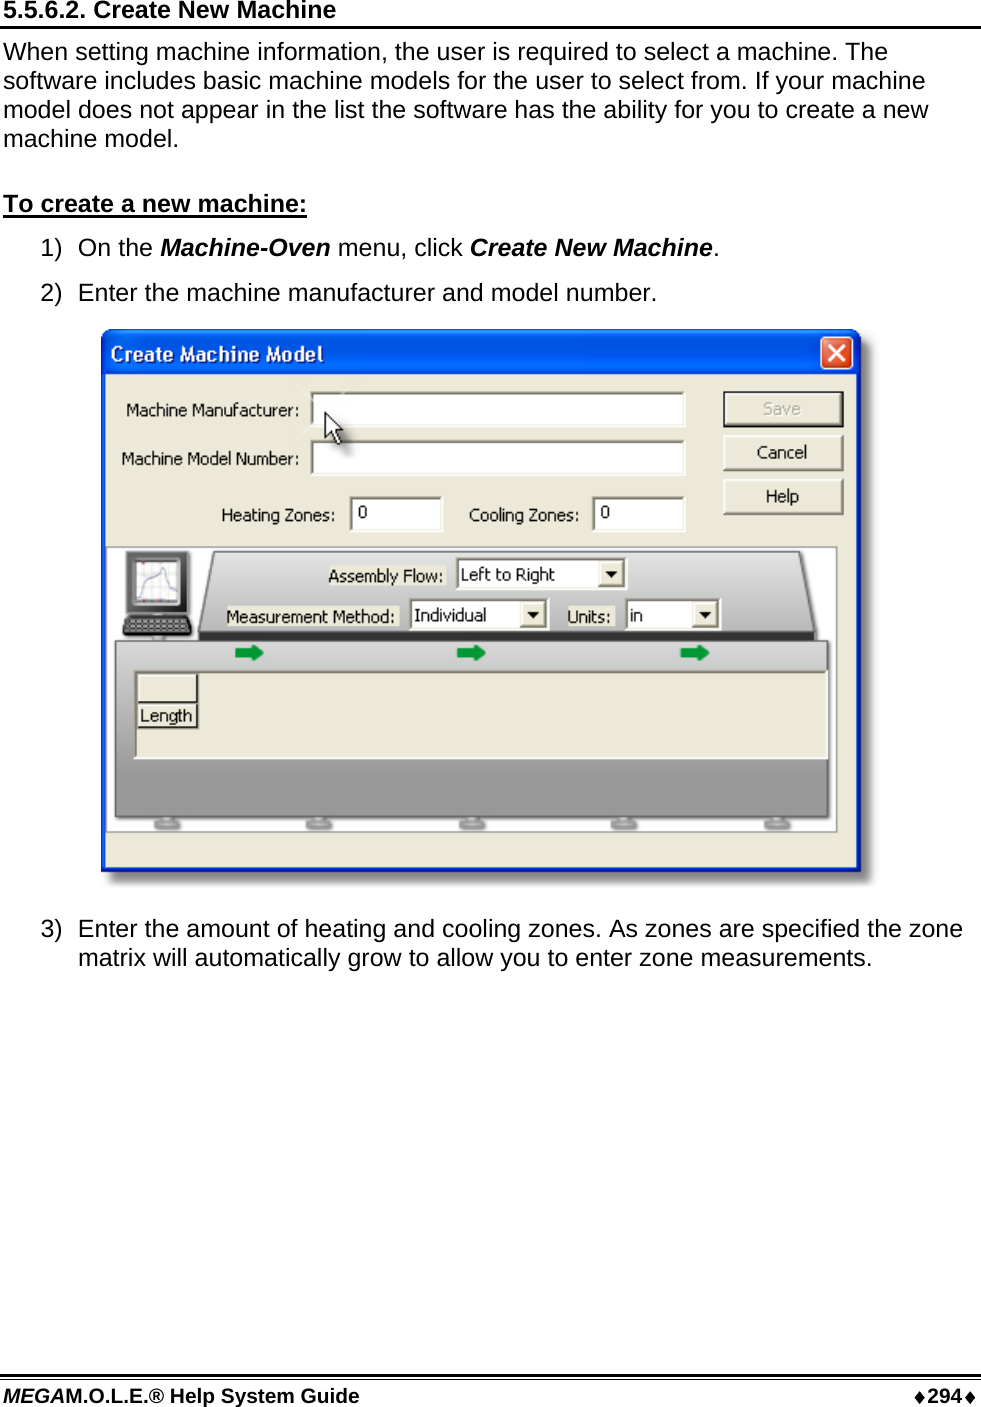
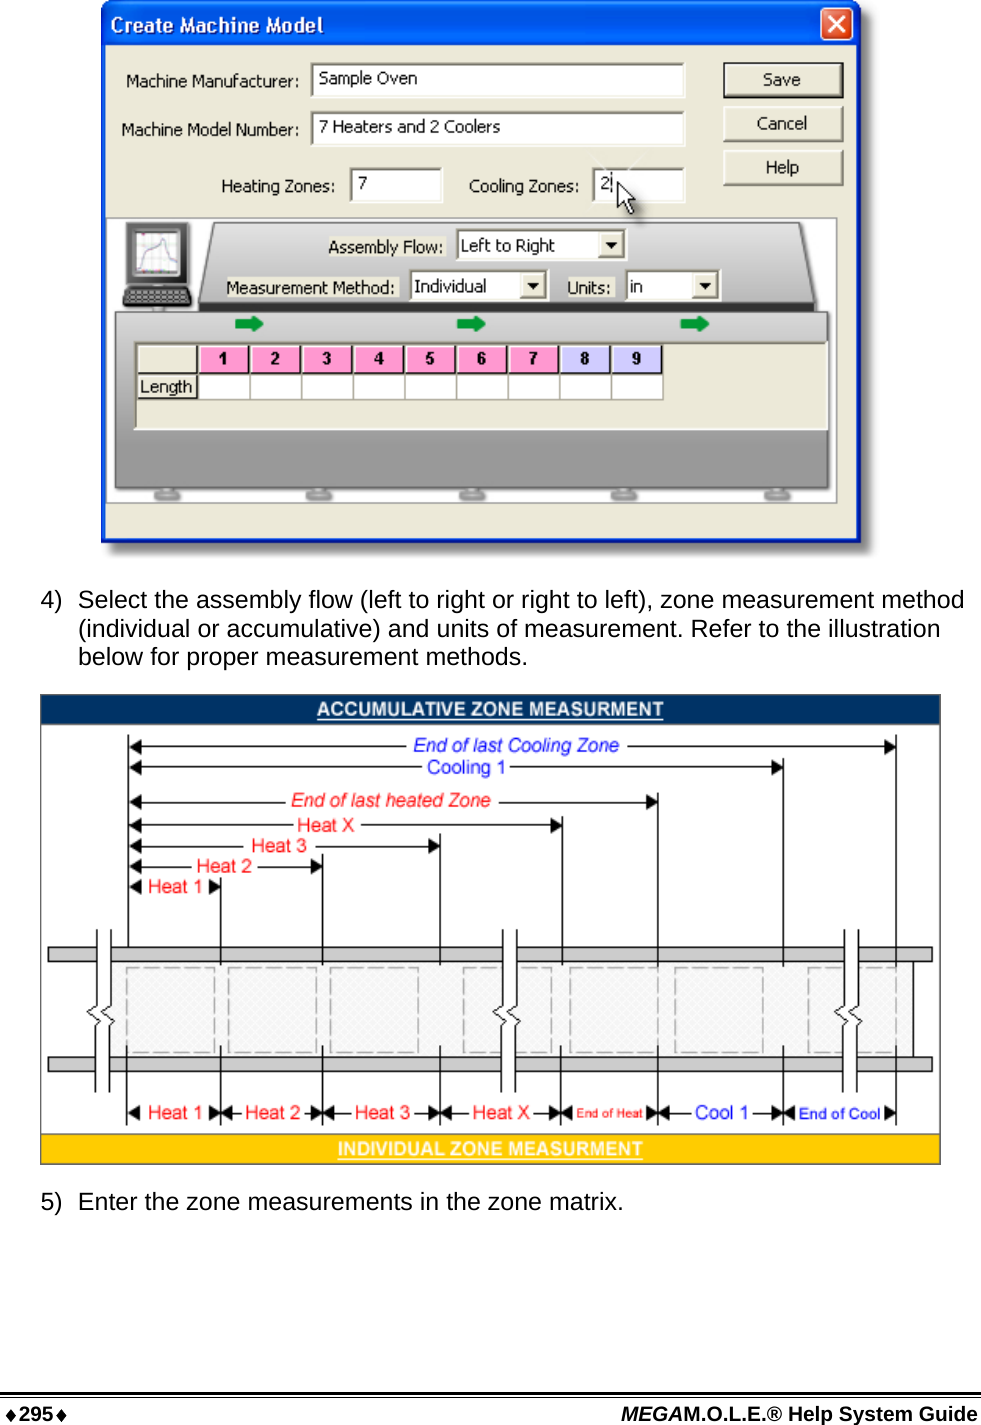
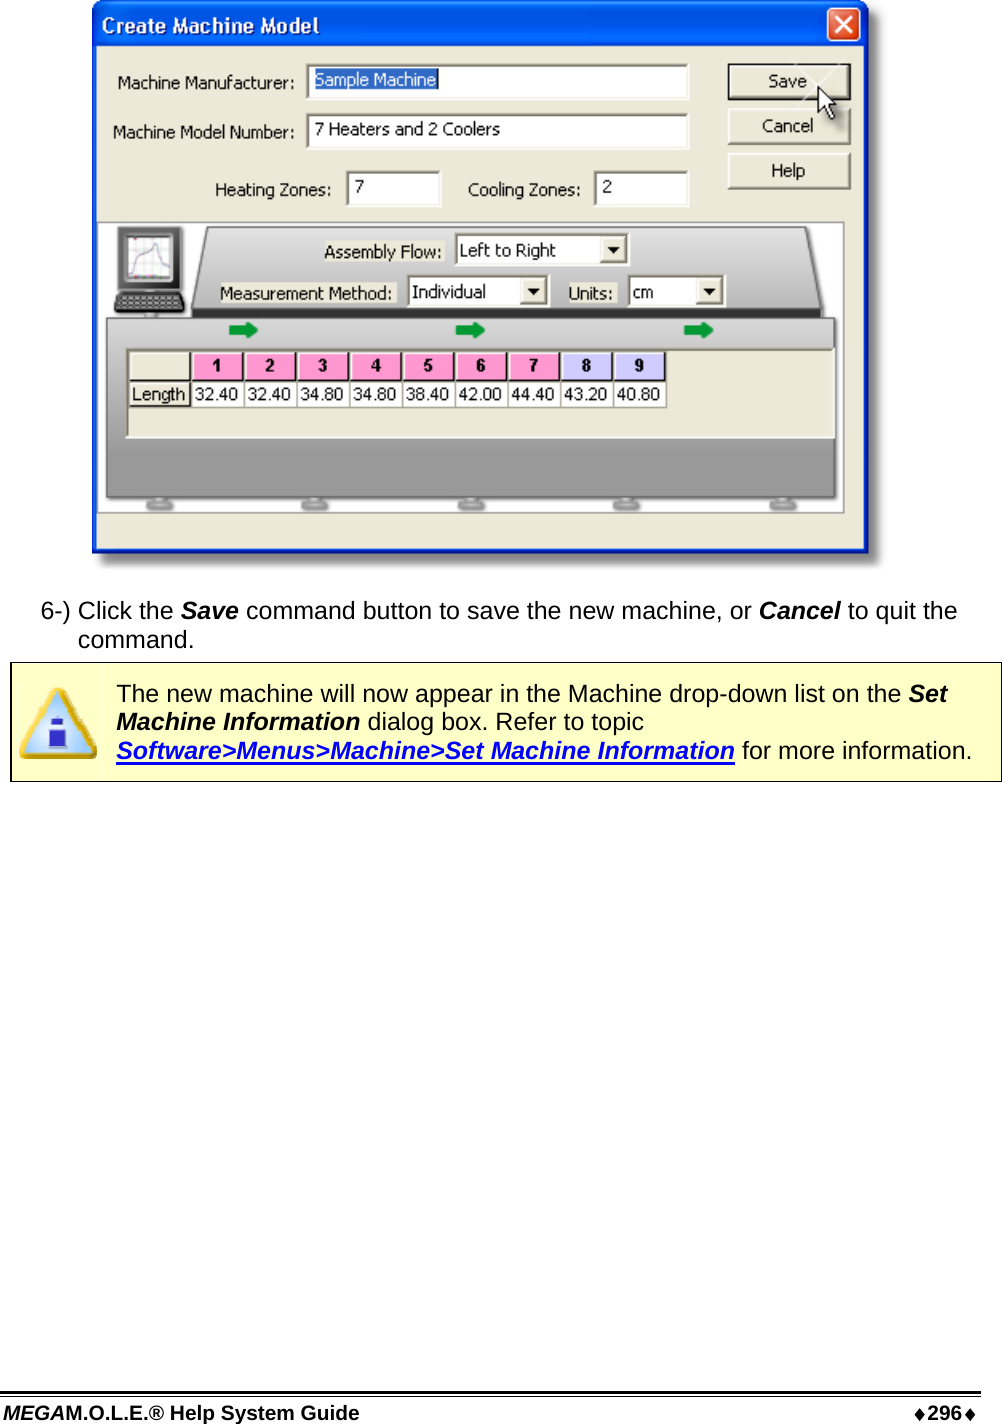
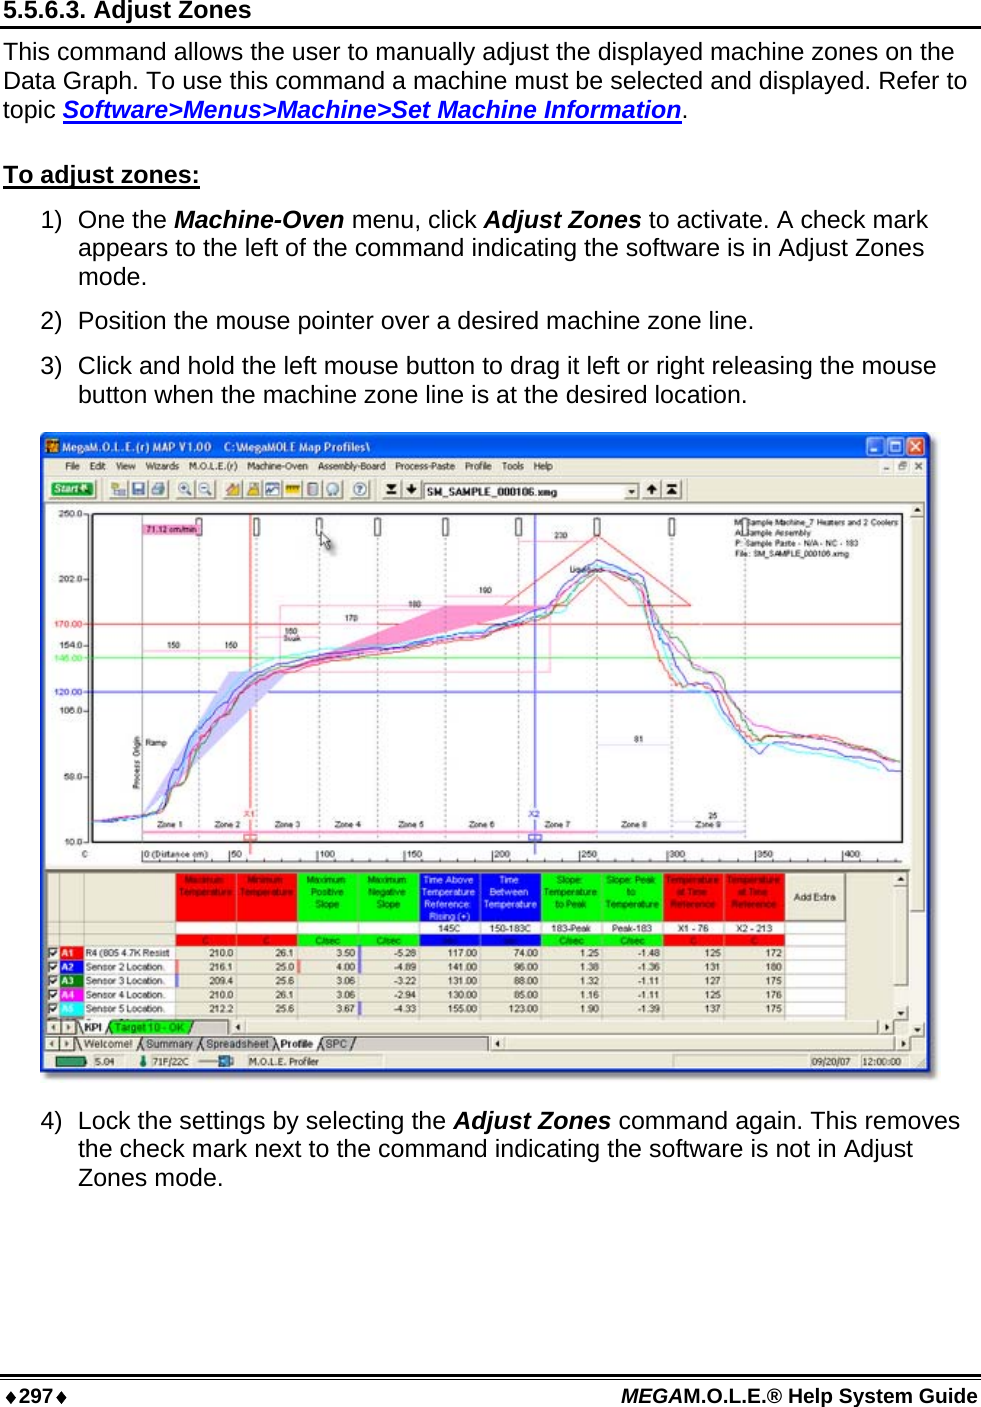
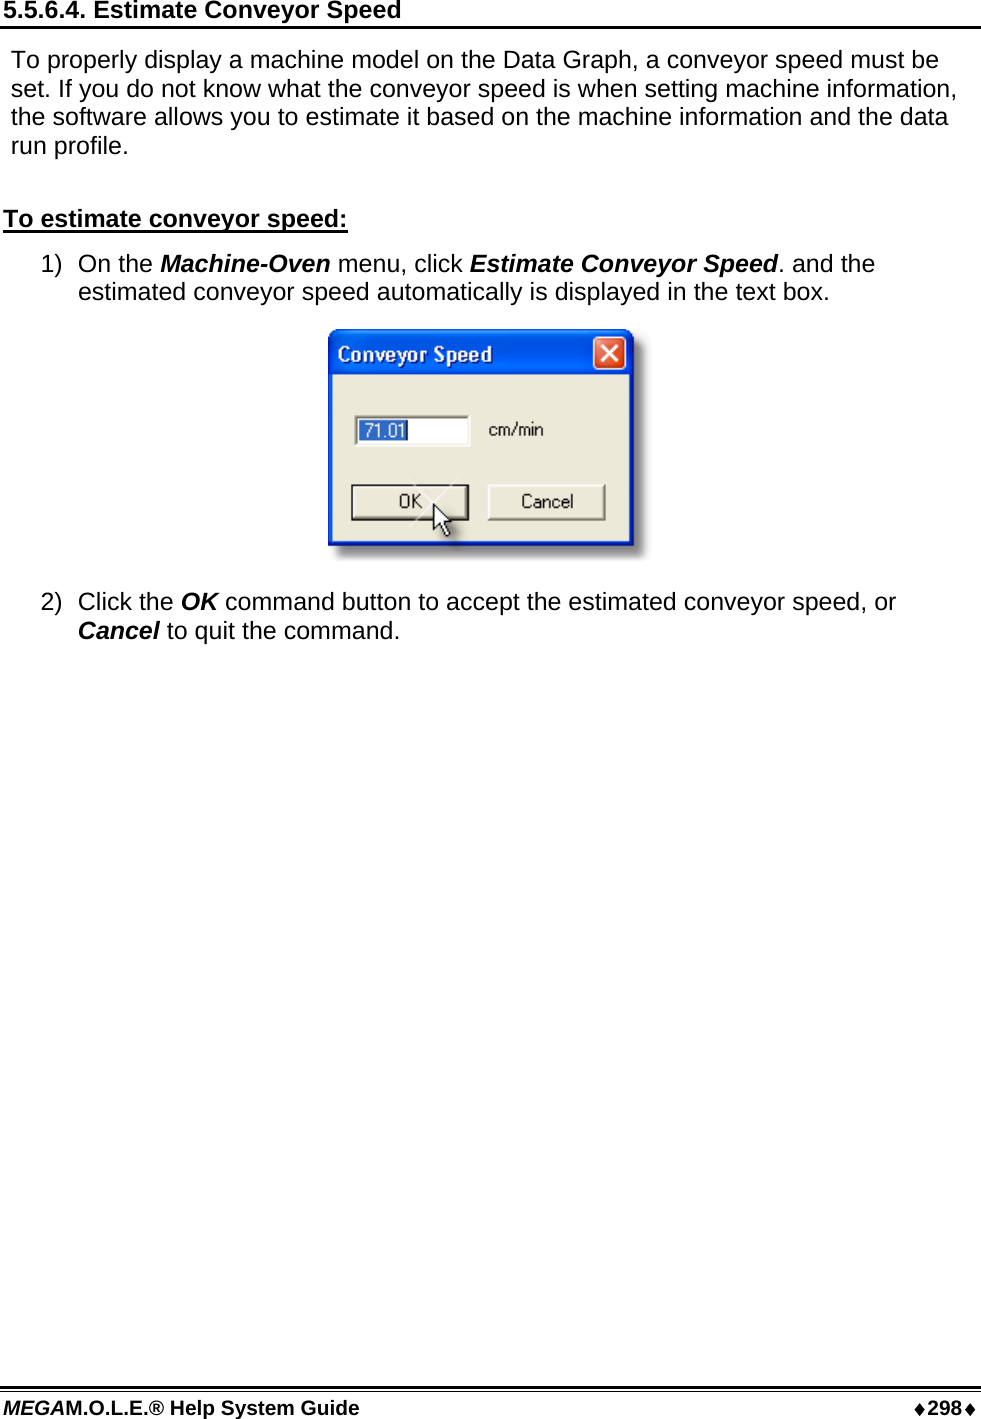
User Manual part 3


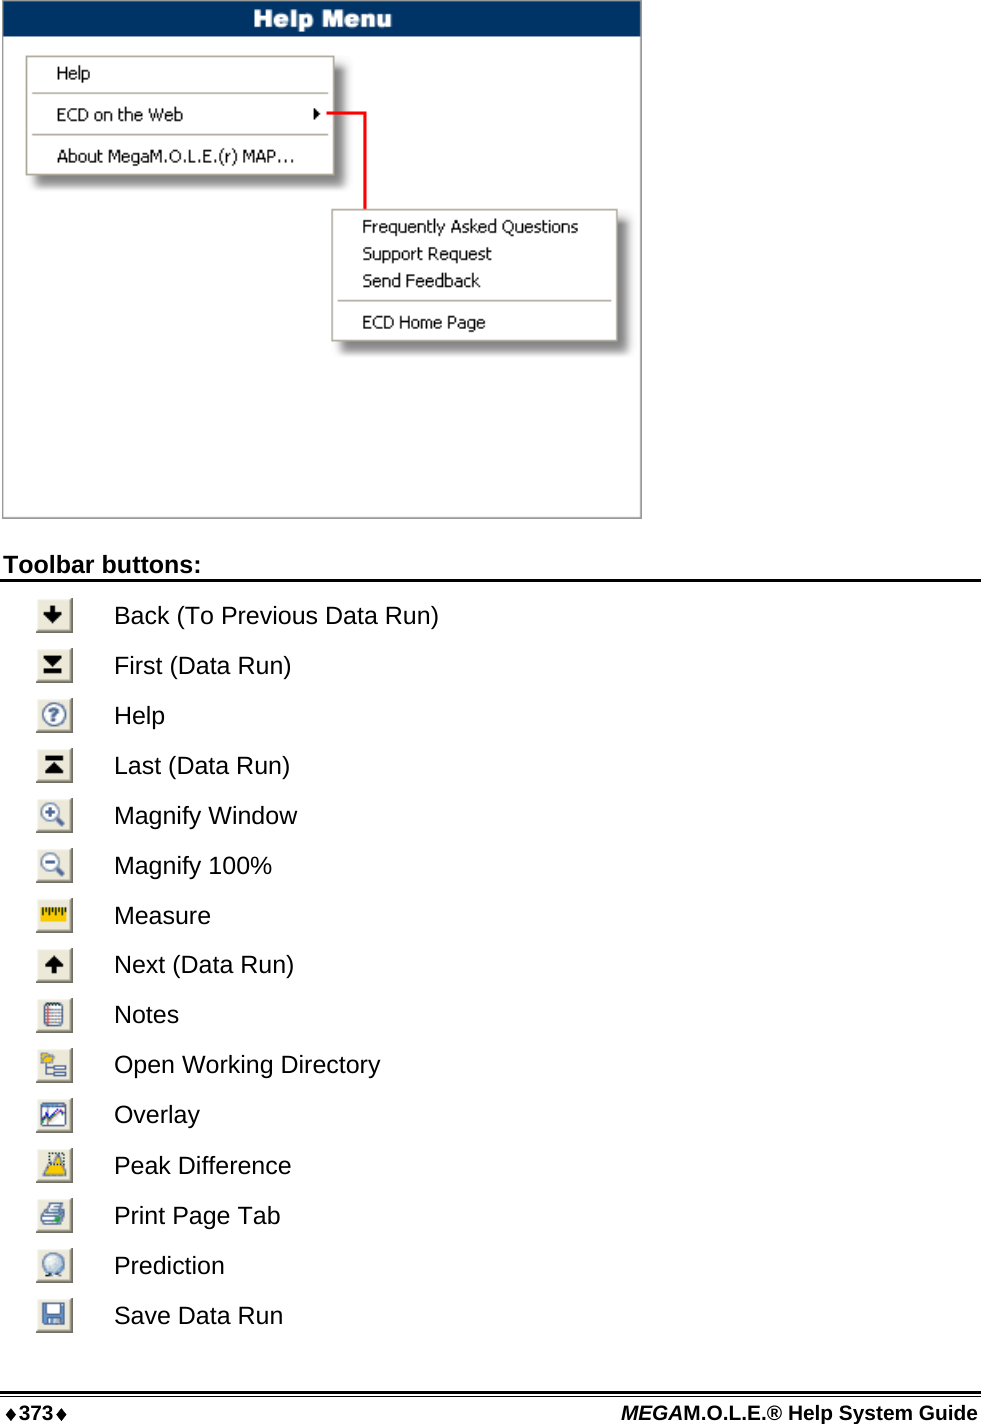
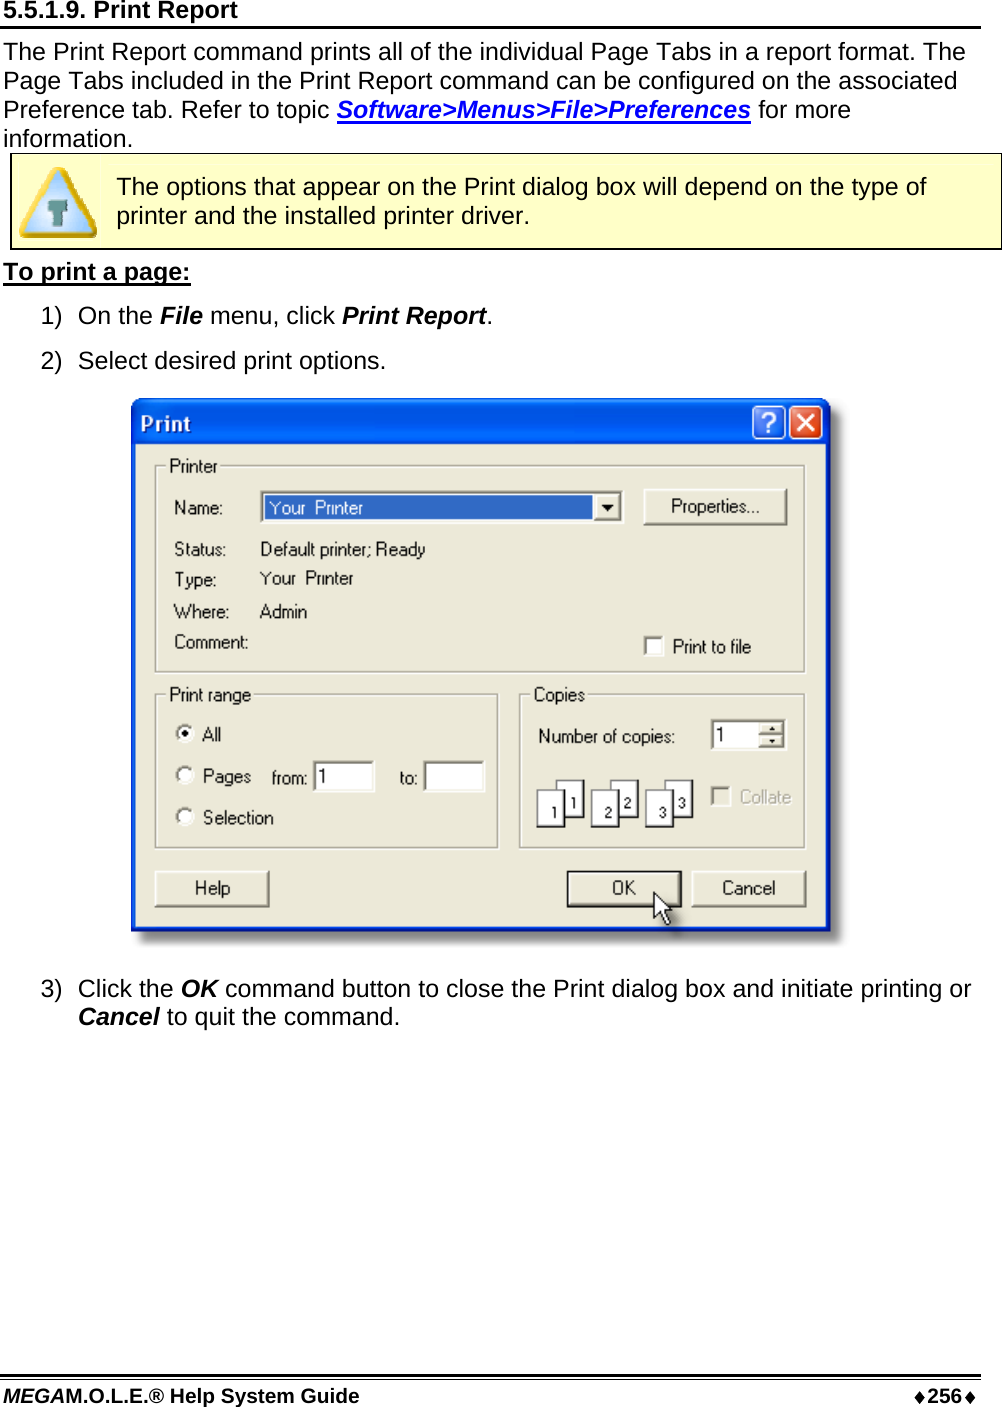
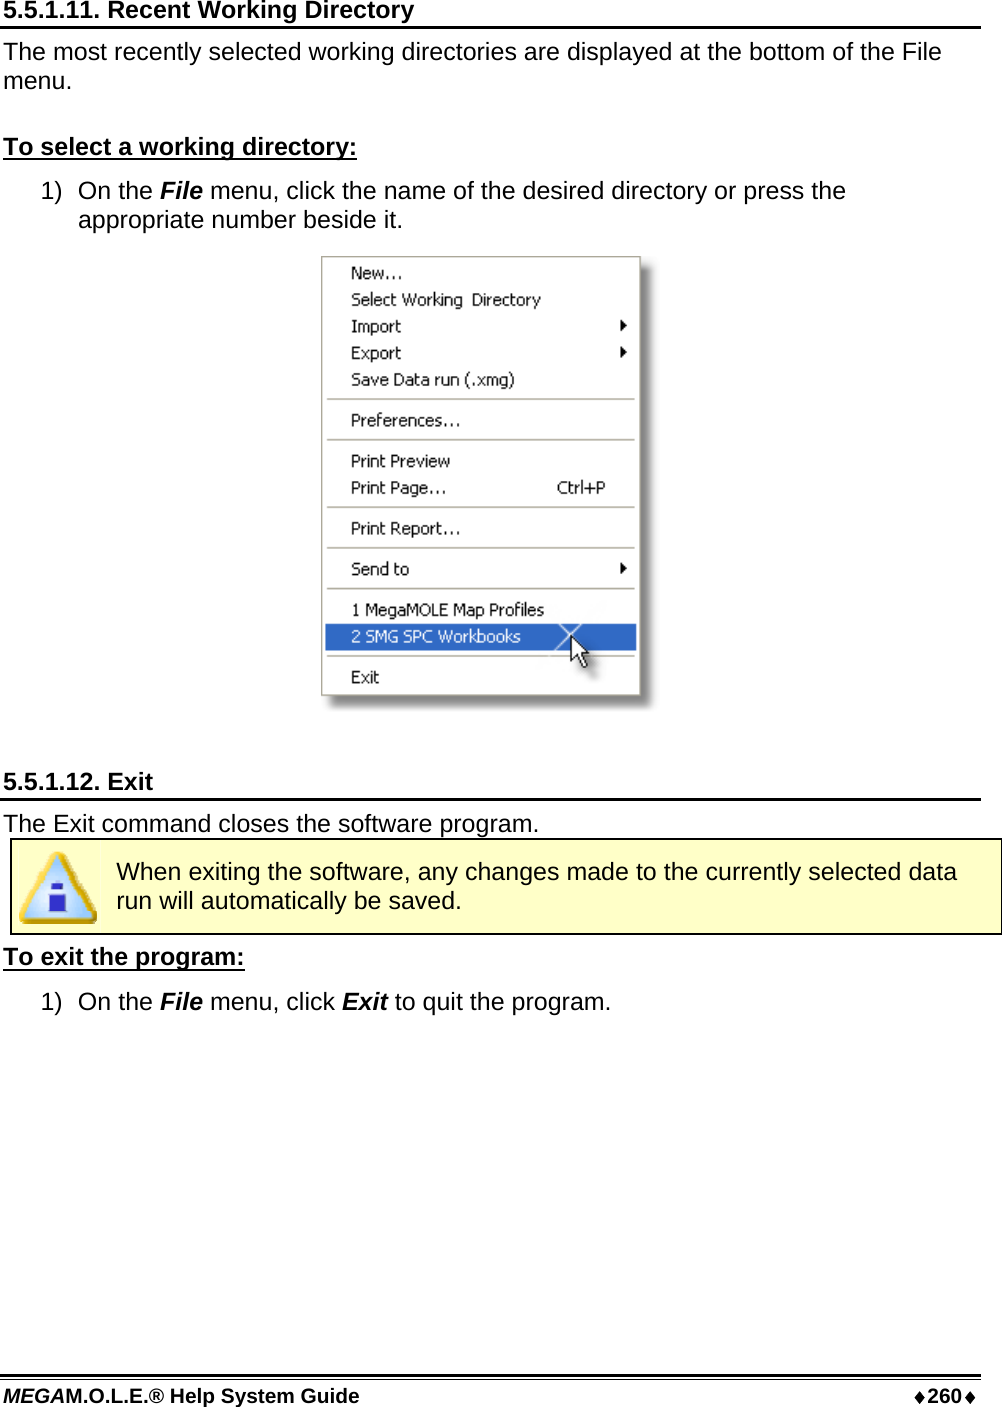
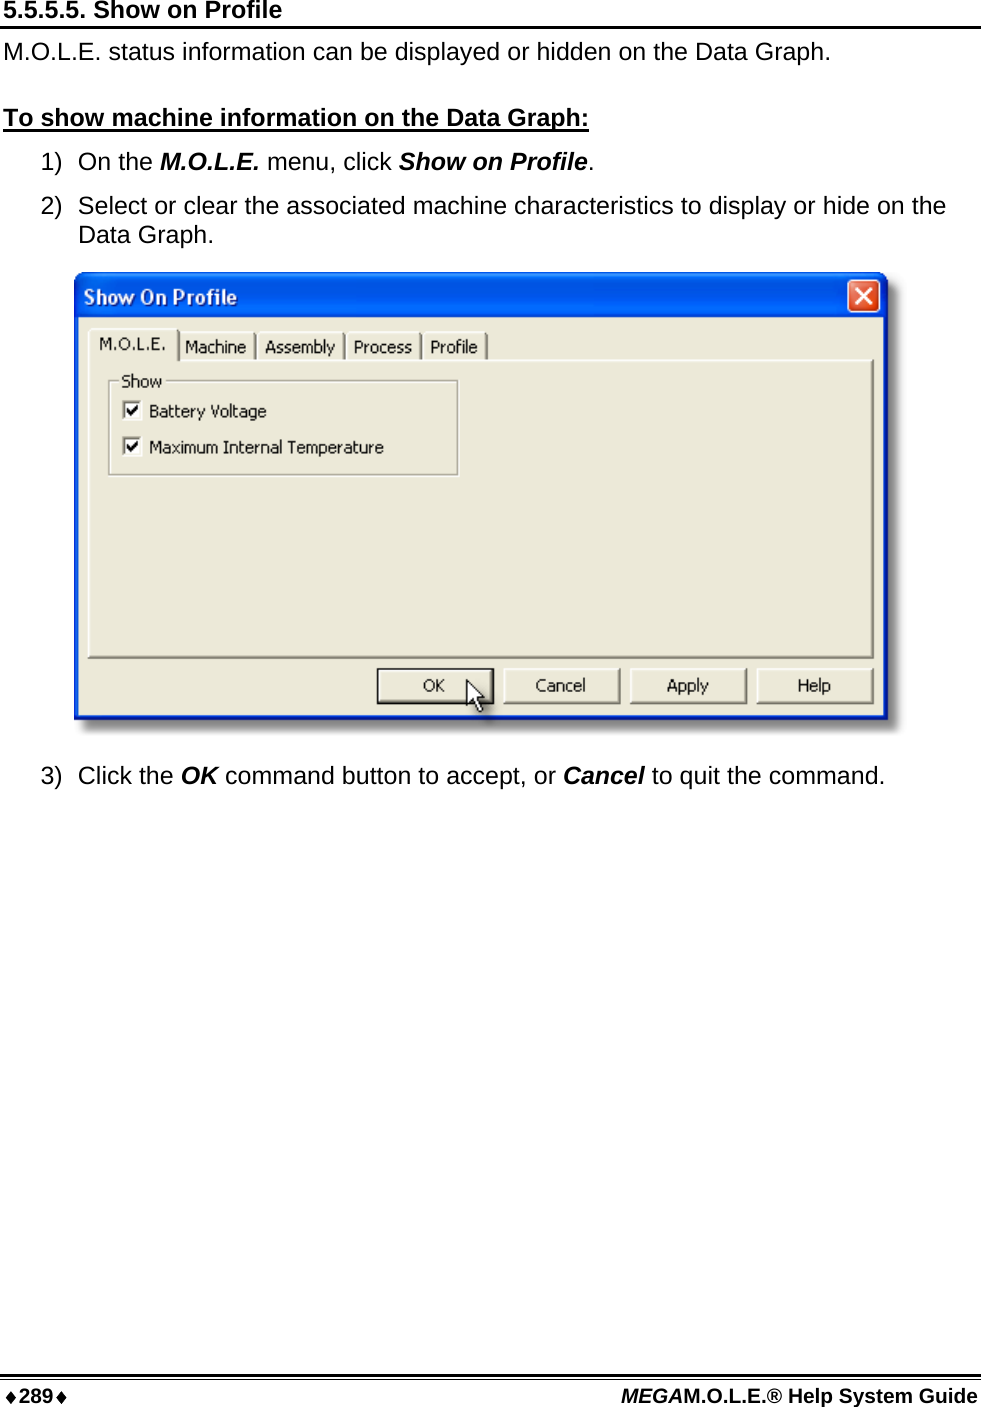
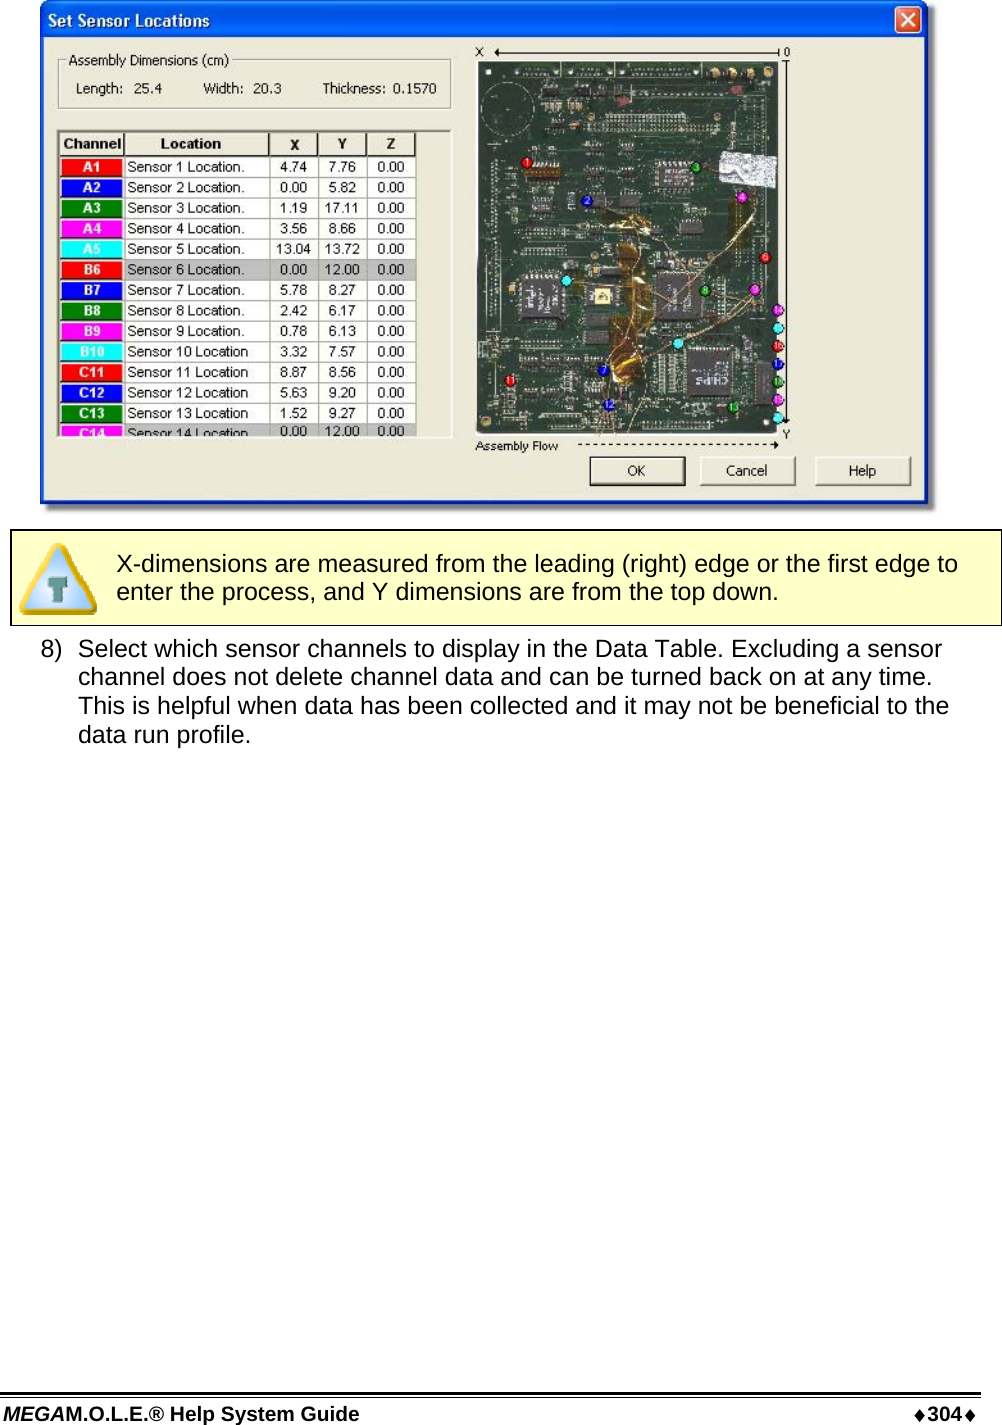
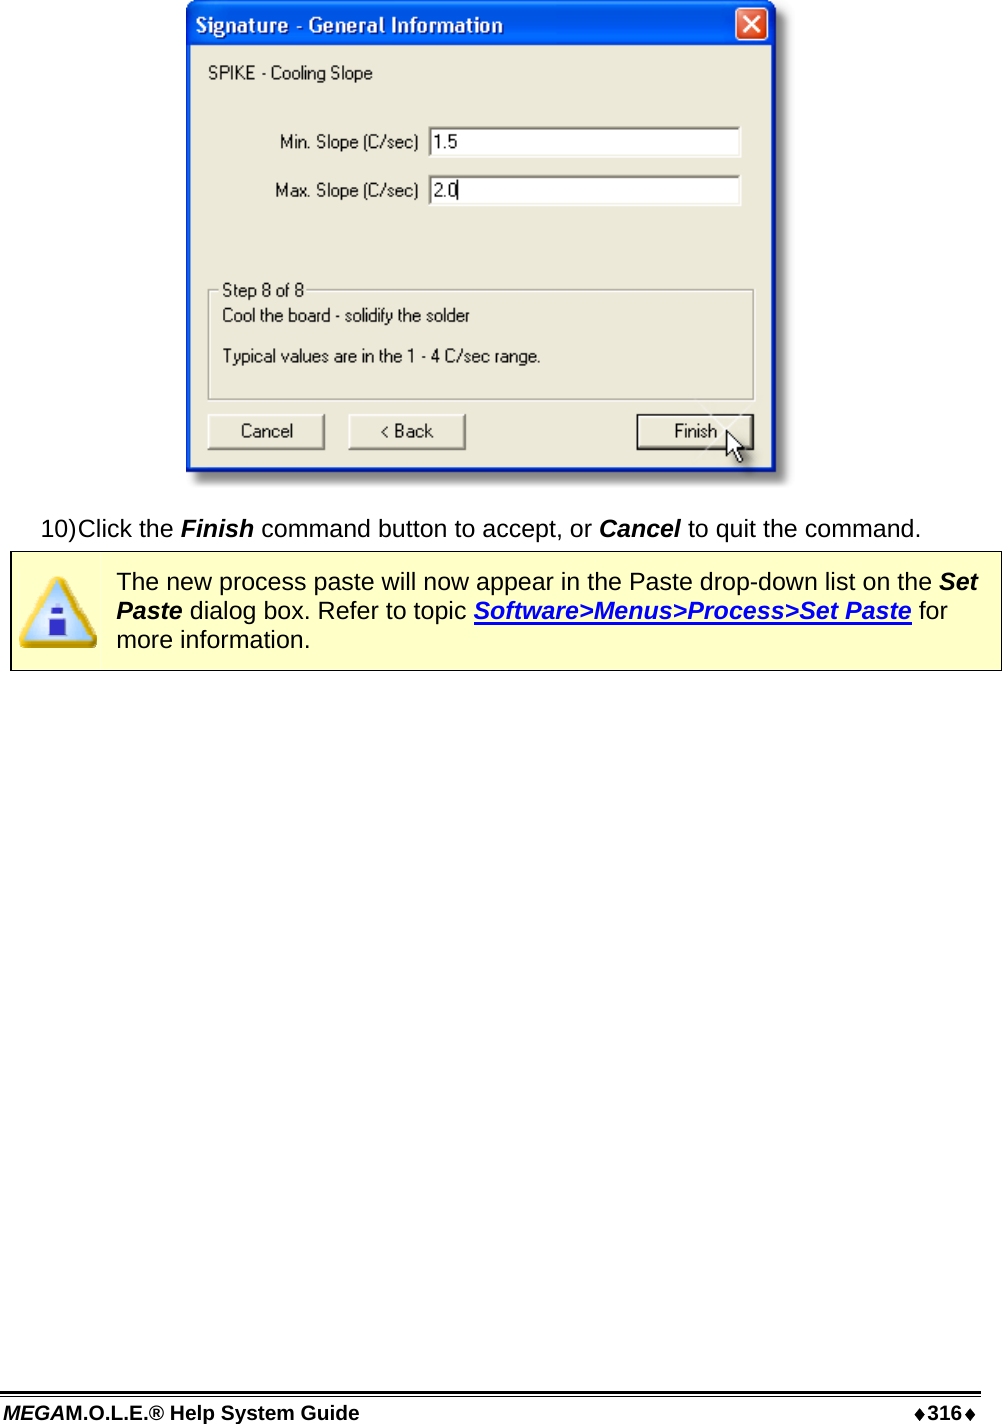
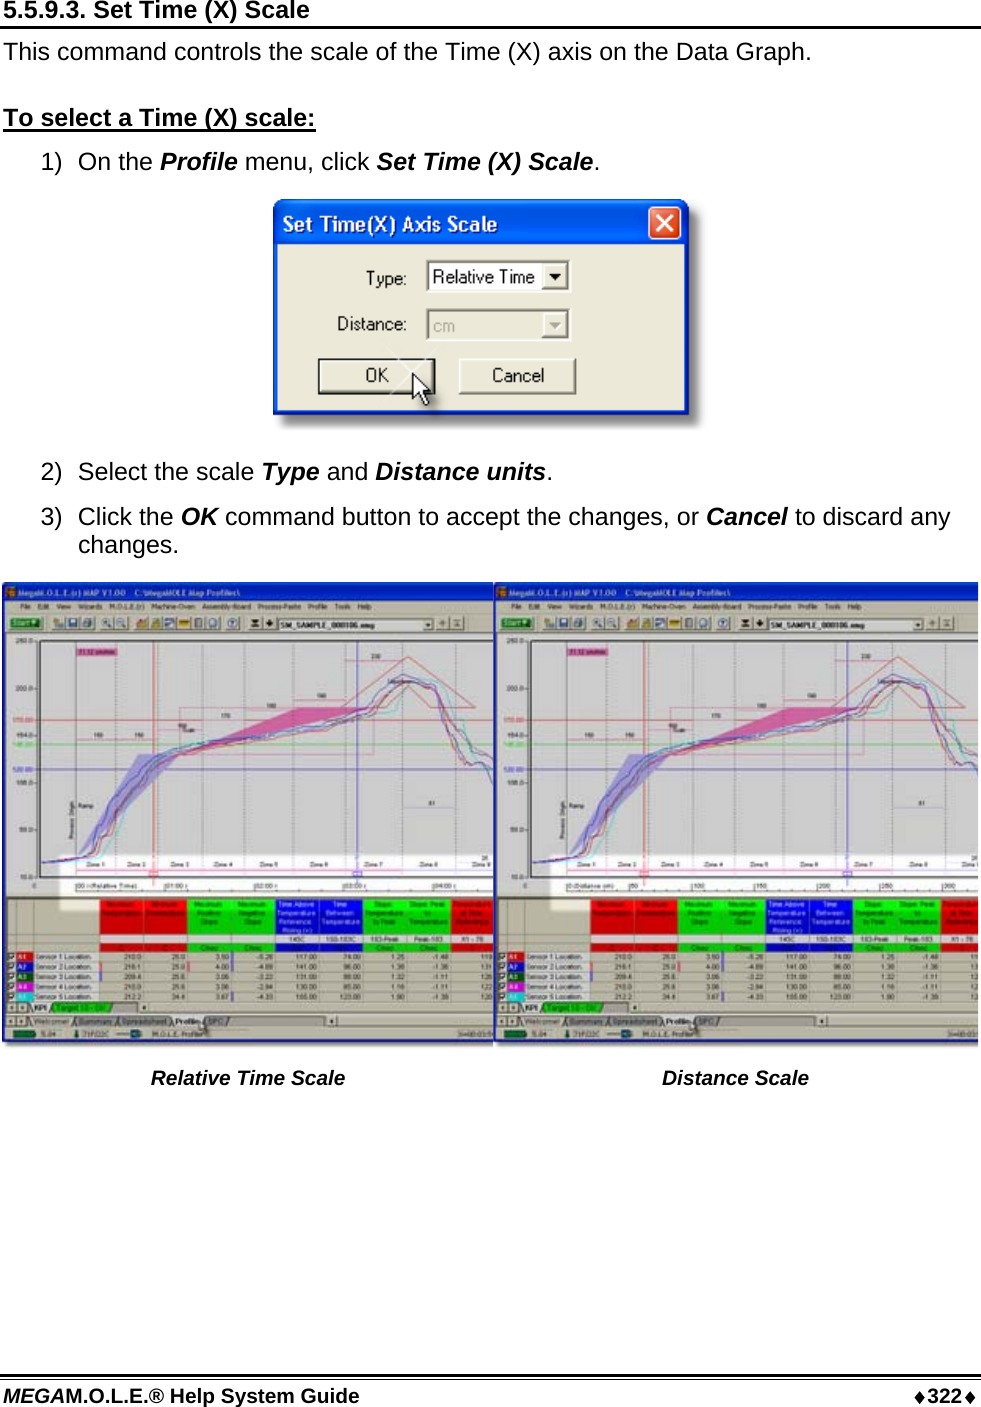
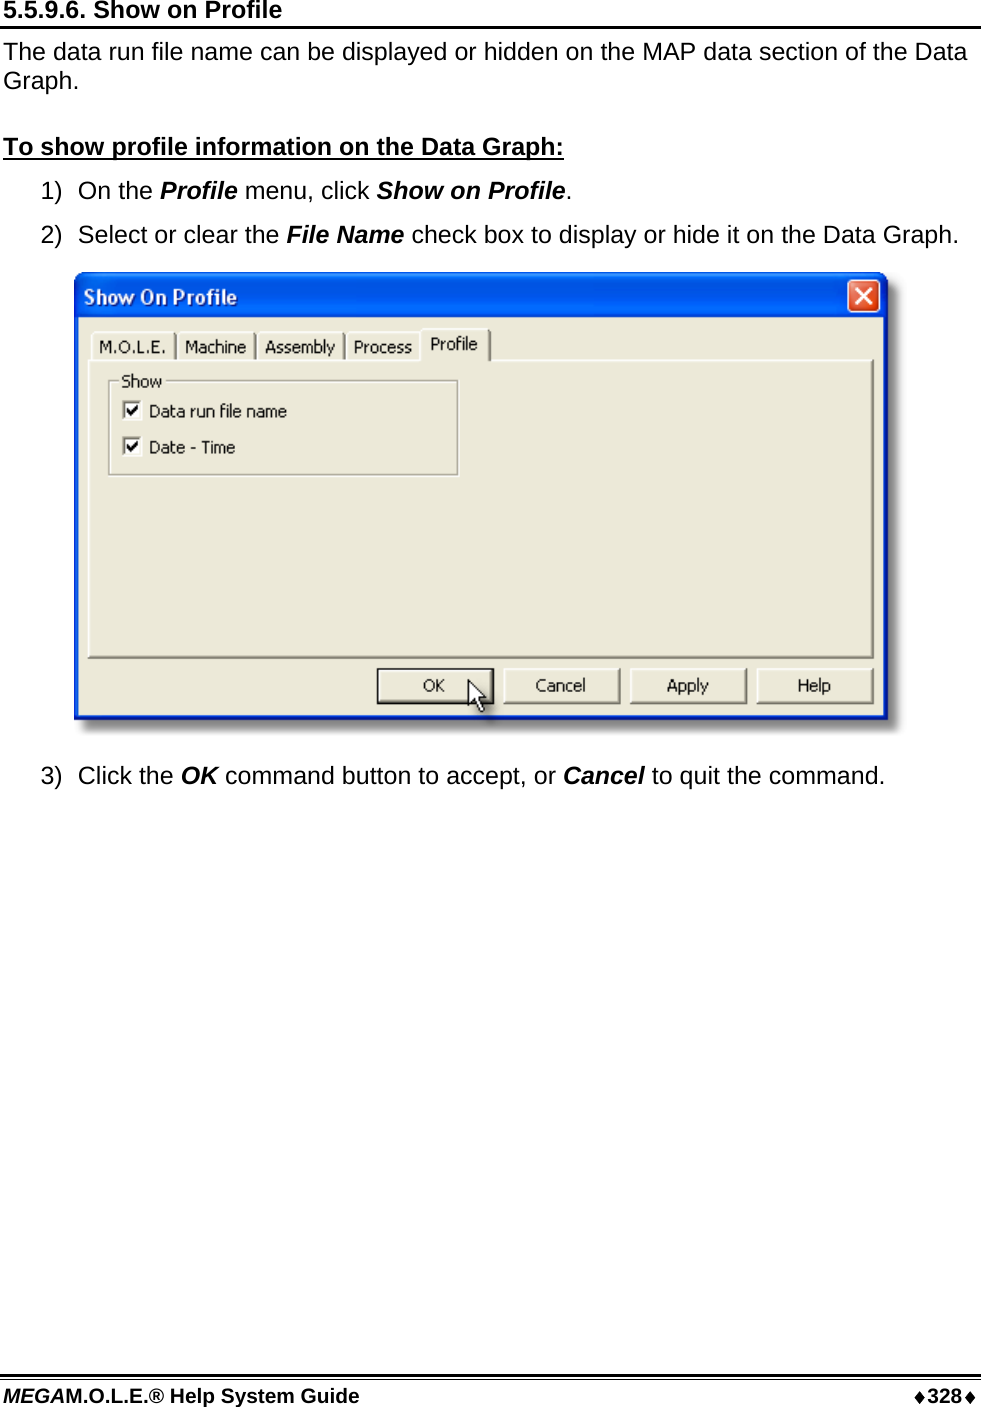
![♦255♦ MEGAM.O.L.E.® Help System Guide 5.5.1.8. Print Page Tab The Print Page Tab command prints the currently displayed Page Tab. The options that appear on the Print dialog box will depend on the type of printer and the installed printer driver. To print a page: 1) On the File menu, click Print. 2) Select desired print options. 3) Click the OK command button to close the Print dialog box and initiate printing or Cancel to quit the command. This command can be accessed on the Toolbar and can also be used by pressing the shortcut keys [CTRL + P]. Print Page Tab Button](https://usermanual.wiki/Electronic-Controls-Design/E47-6342-45.User-Manual-part-3/User-Guide-937651-Page-7.png)
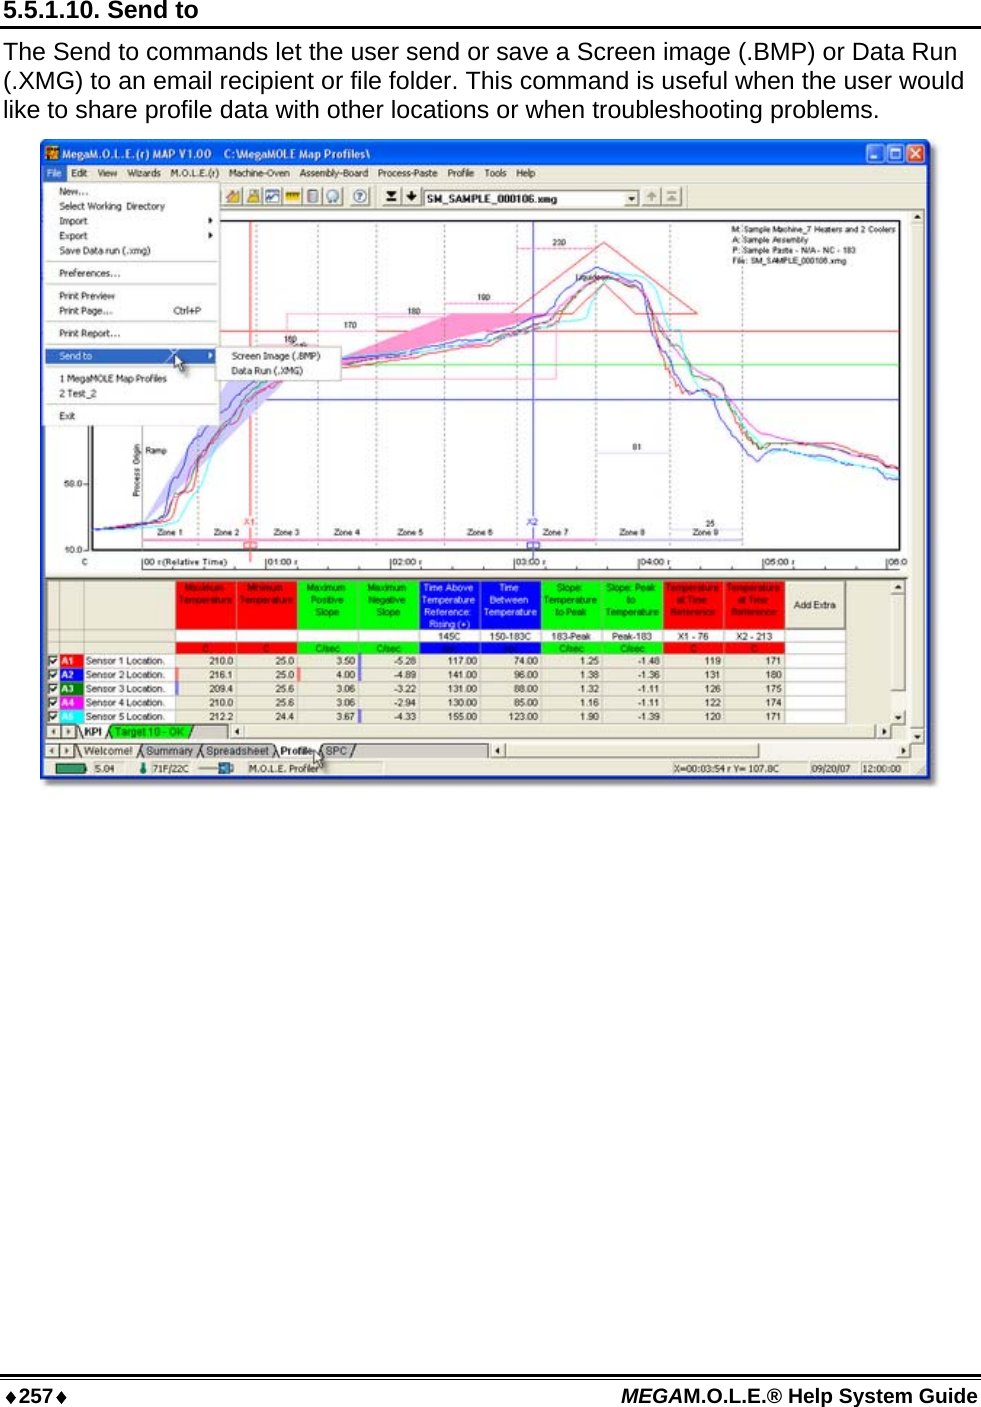
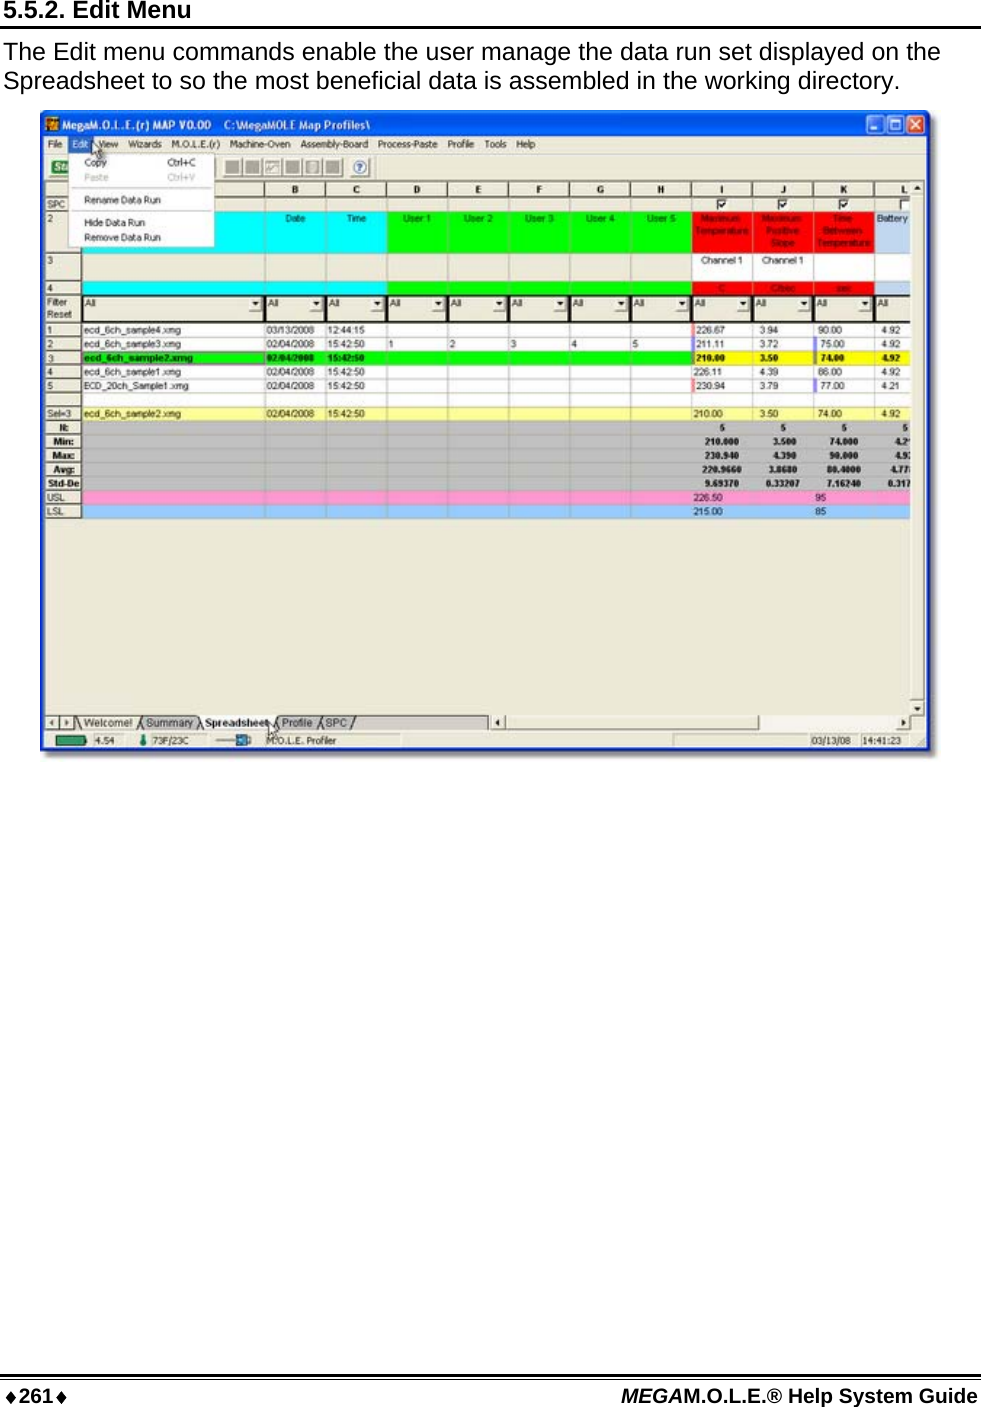
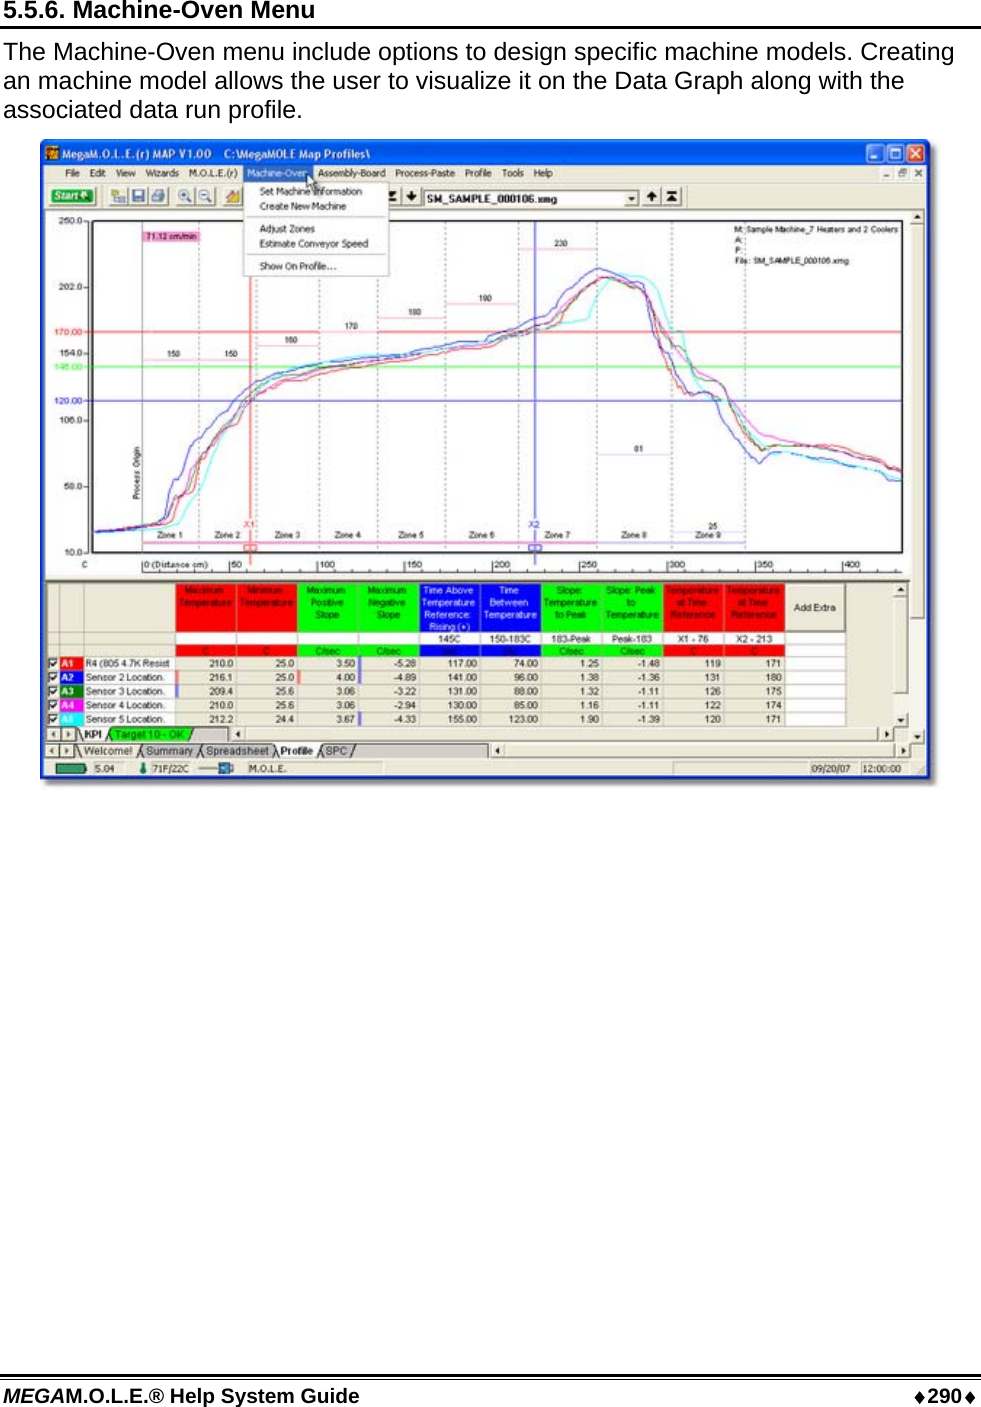
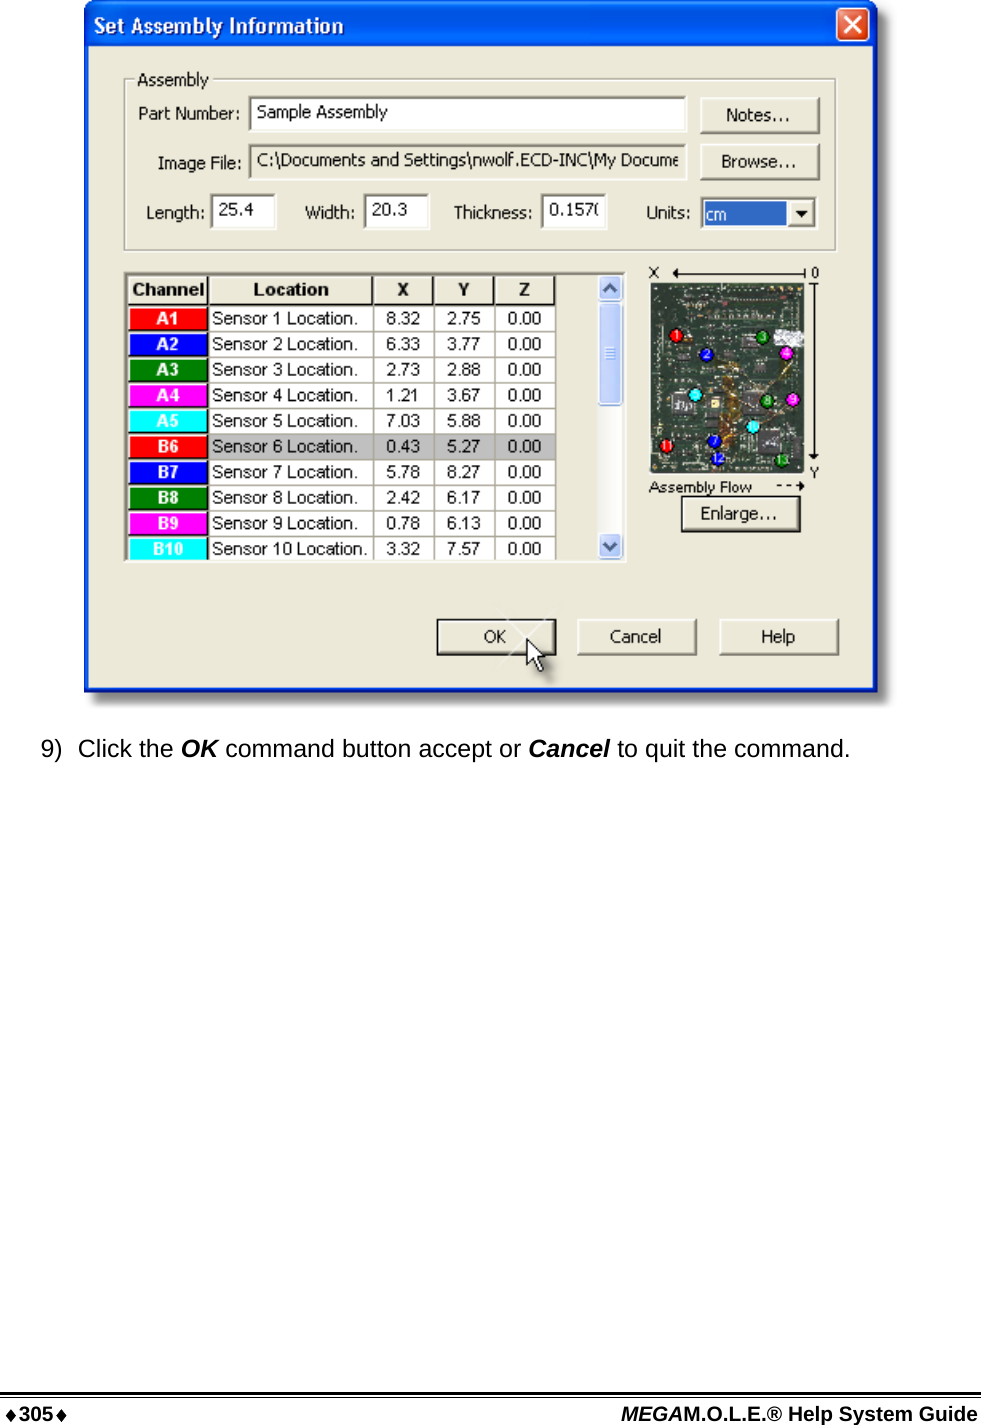
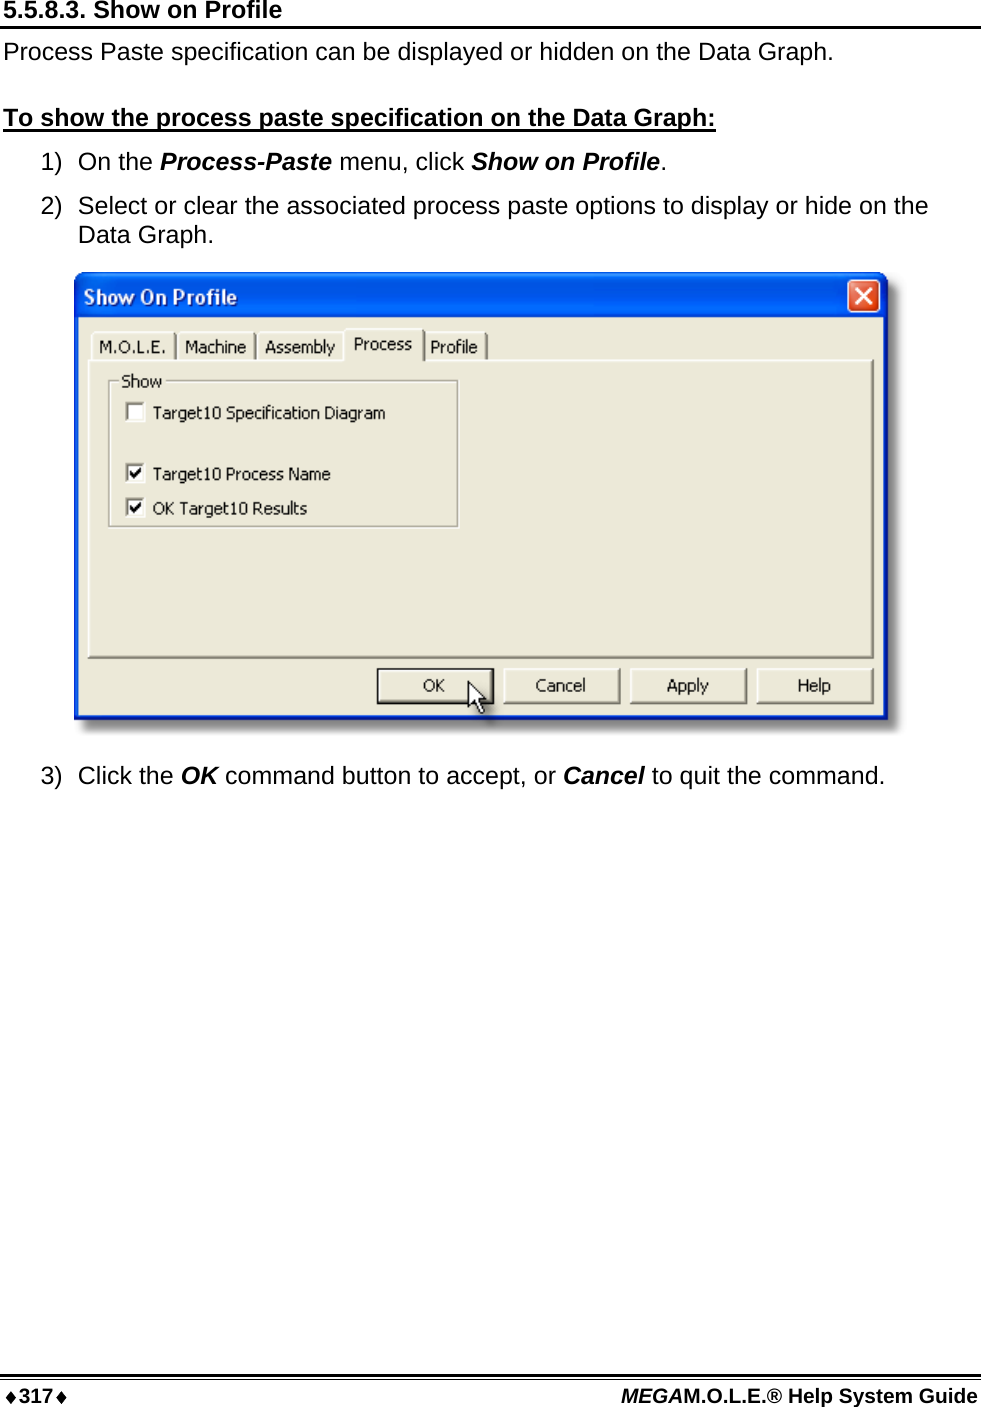
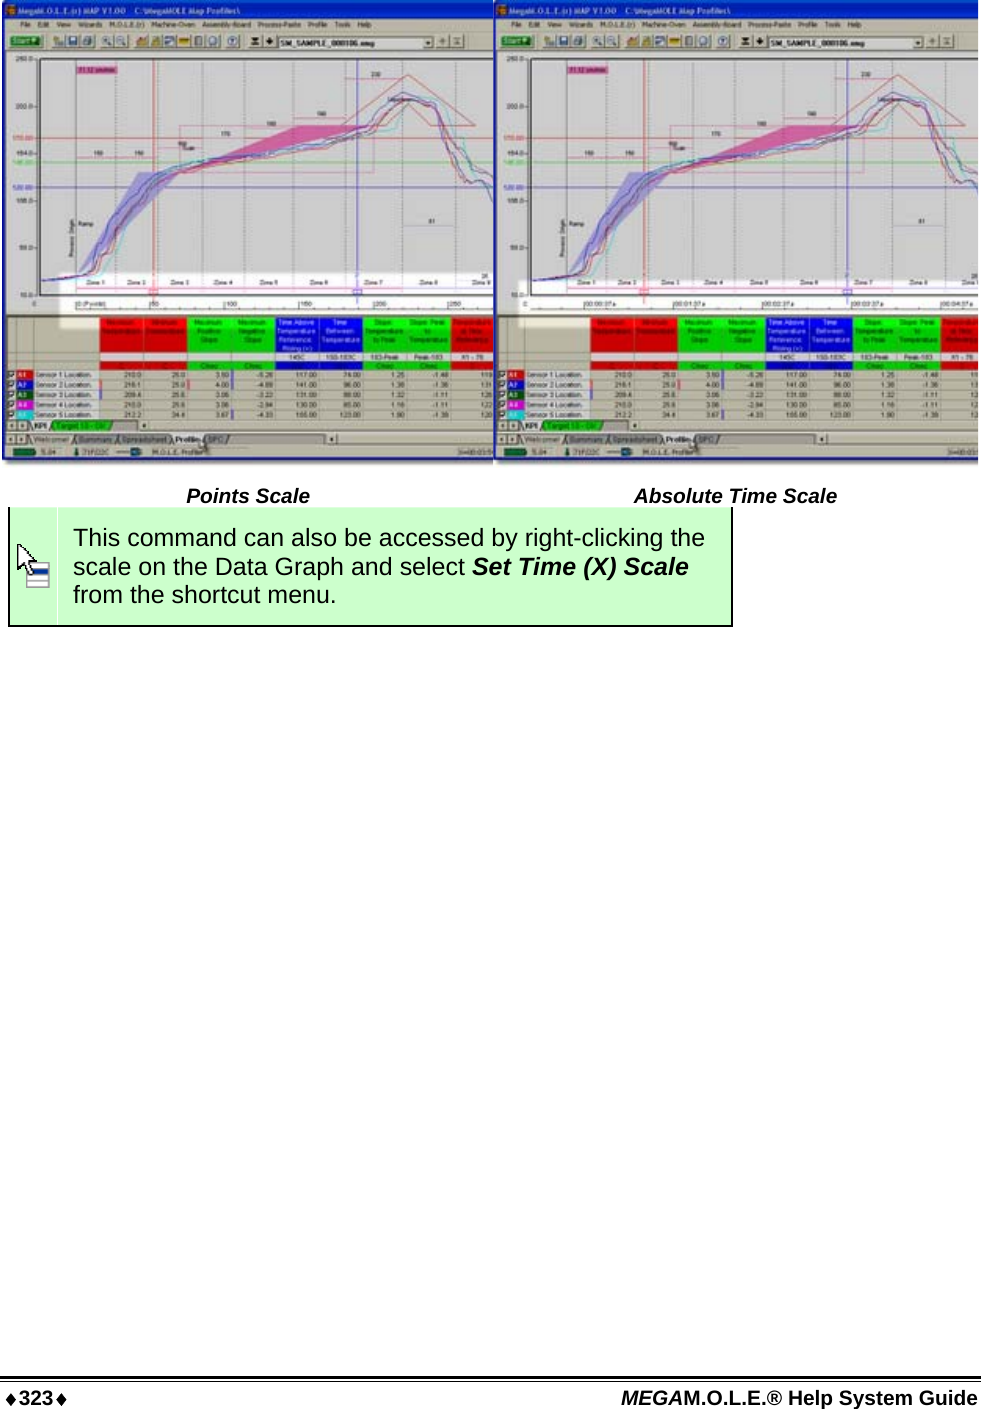
![MEGAM.O.L.E.® Help System Guide ♦262♦ 5.5.2.1. Copy To copy data: 1) Select the Spreadsheet Page Tab. 2) Highlight a Spreadsheet data run row or individual cell. 3) On the Edit menu, click Copy to copy the data in the selected Spreadsheet cells for pasting into other user definable cells or different programs. This command can also be used by pressing the shortcut keys [CTRL +C].](https://usermanual.wiki/Electronic-Controls-Design/E47-6342-45.User-Manual-part-3/User-Guide-937651-Page-14.png)
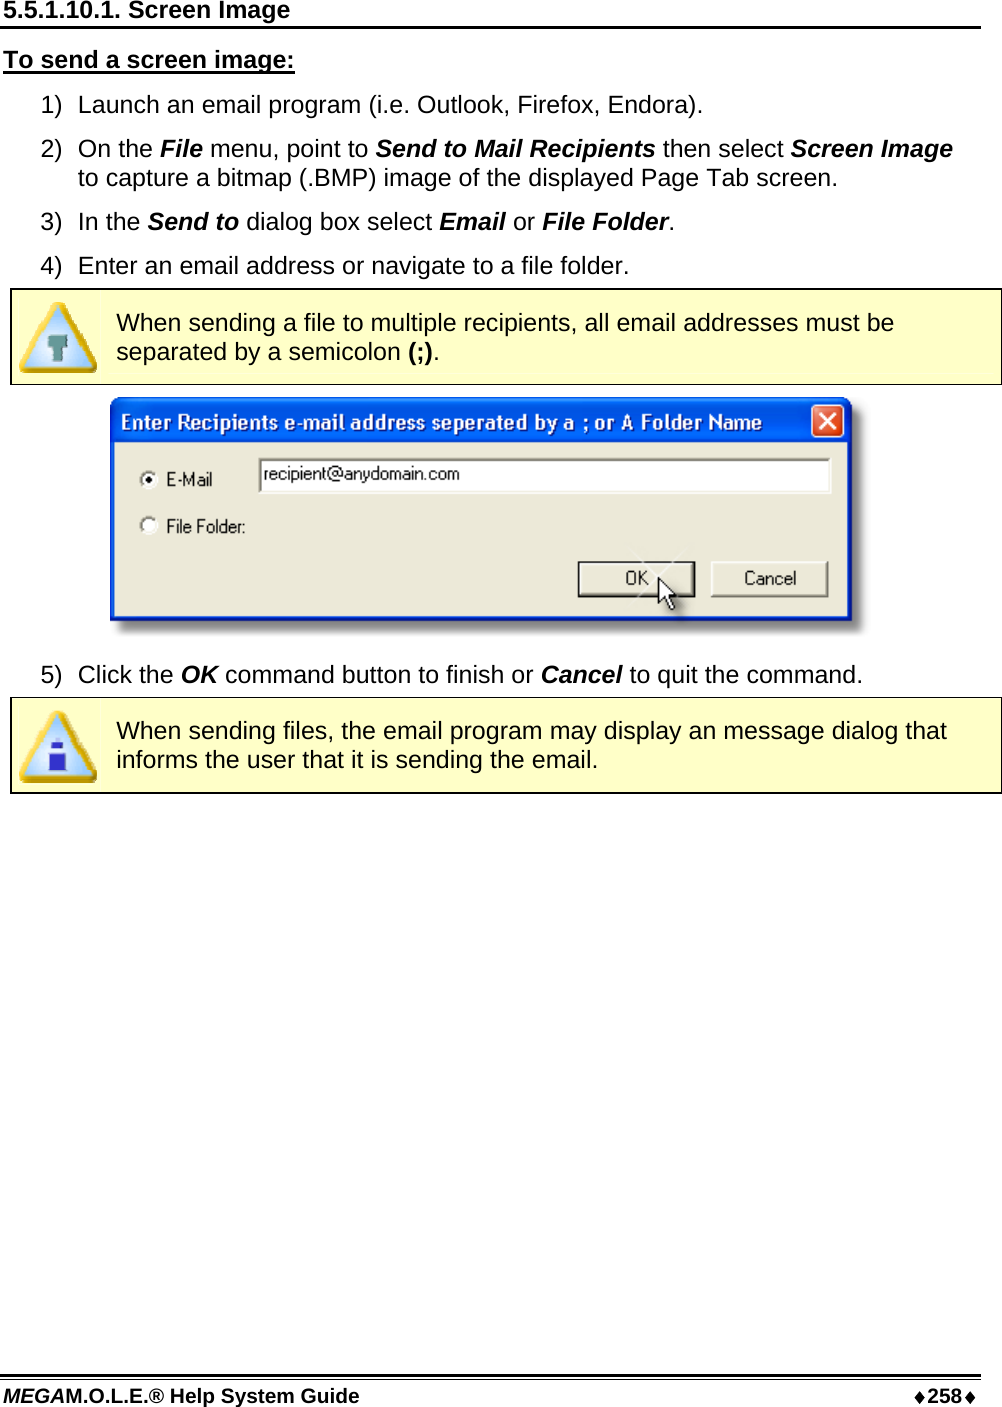
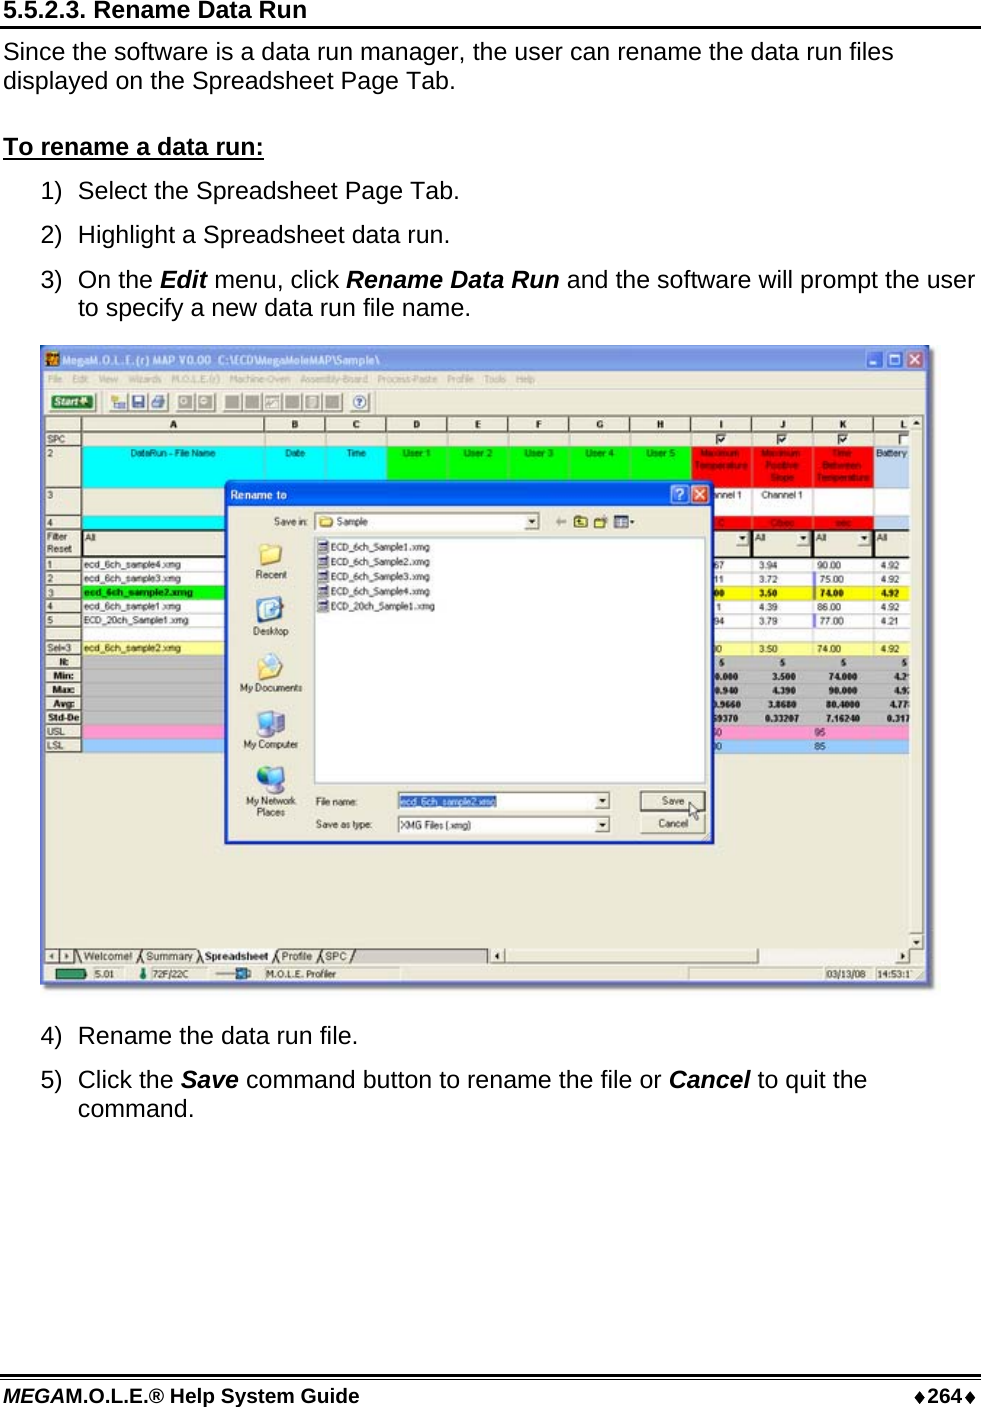
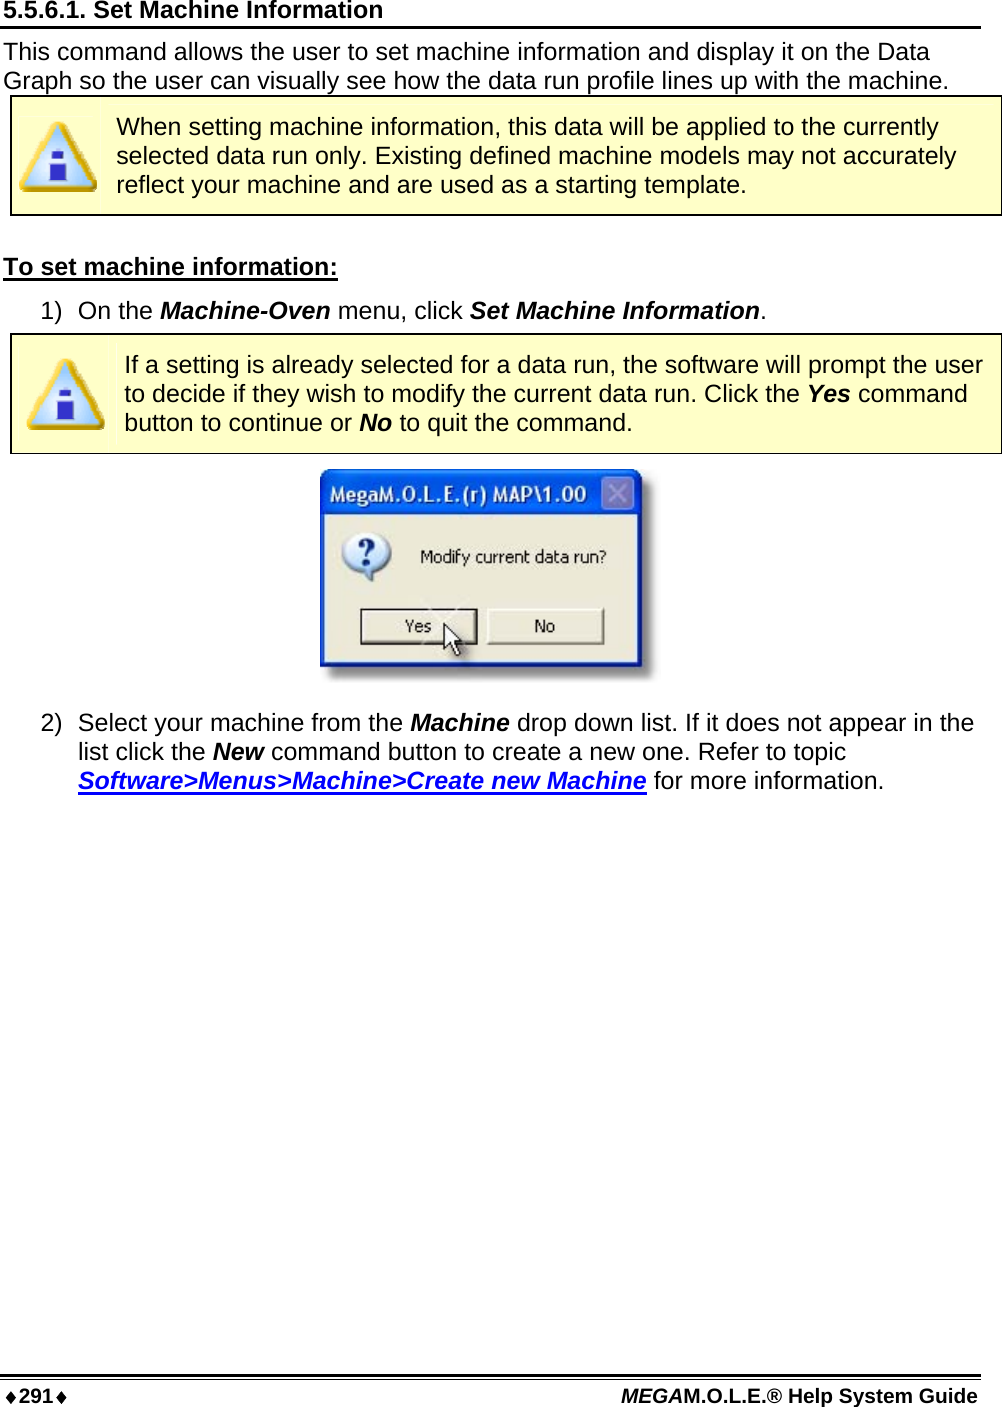
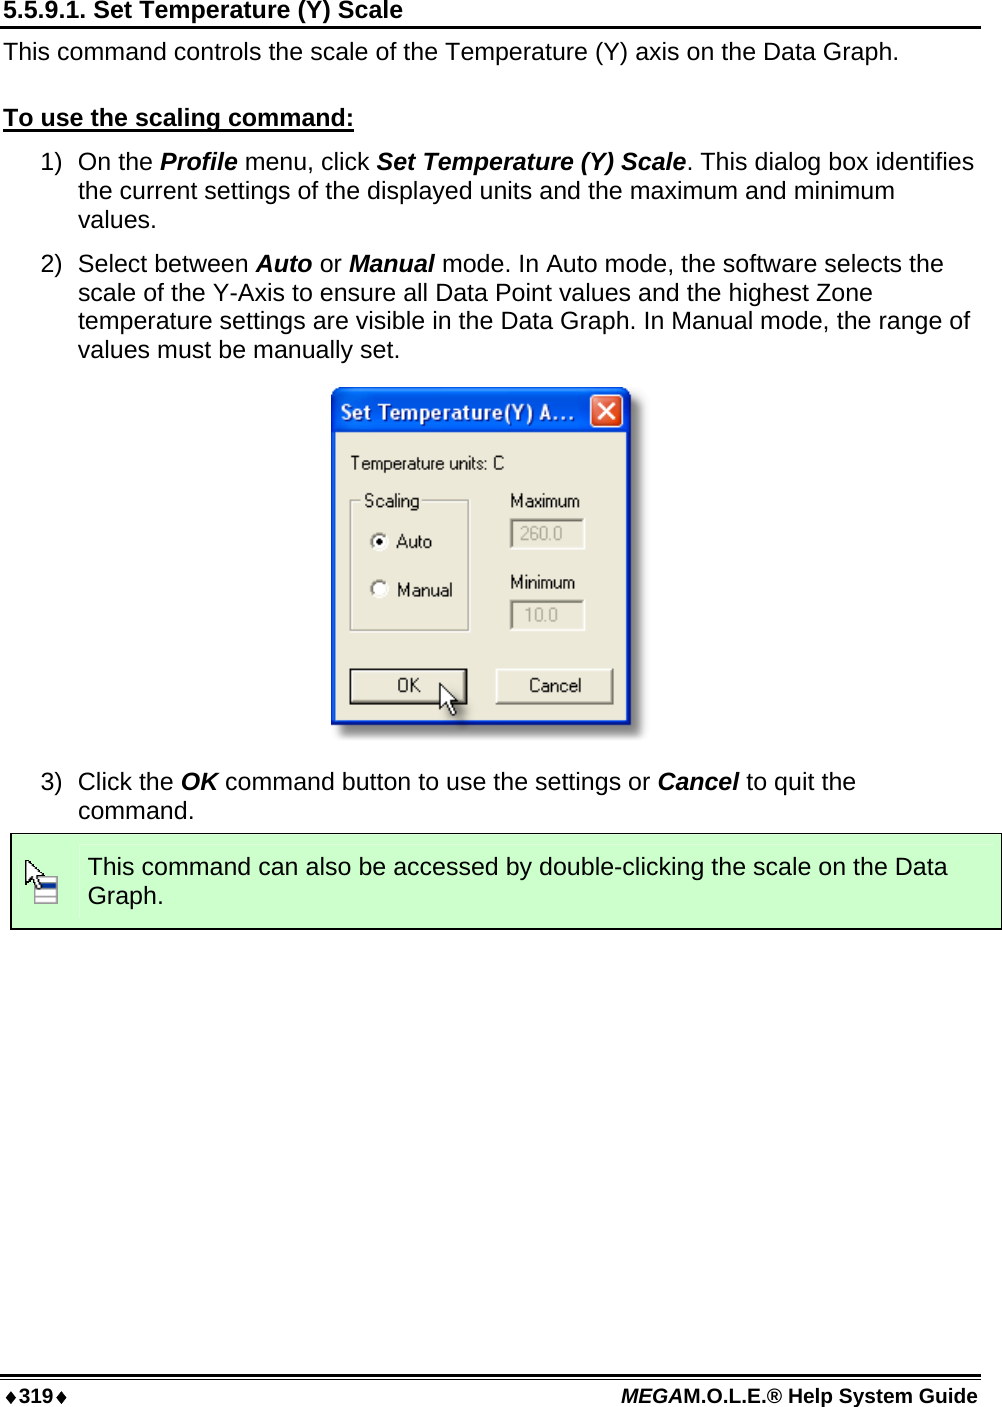
![♦263♦ MEGAM.O.L.E.® Help System Guide 5.5.2.2. Paste To paste data: 1) Select the Spreadsheet Page Tab. 2) Highlight a user definable cell. User definable cells have label headers of User 1-5 and are colored green. 3) On the Edit menu, click Paste, to paste the data in the selected Spreadsheet cells. This command can also be used by pressing the shortcut keys [CTRL +V].](https://usermanual.wiki/Electronic-Controls-Design/E47-6342-45.User-Manual-part-3/User-Guide-937651-Page-15.png)


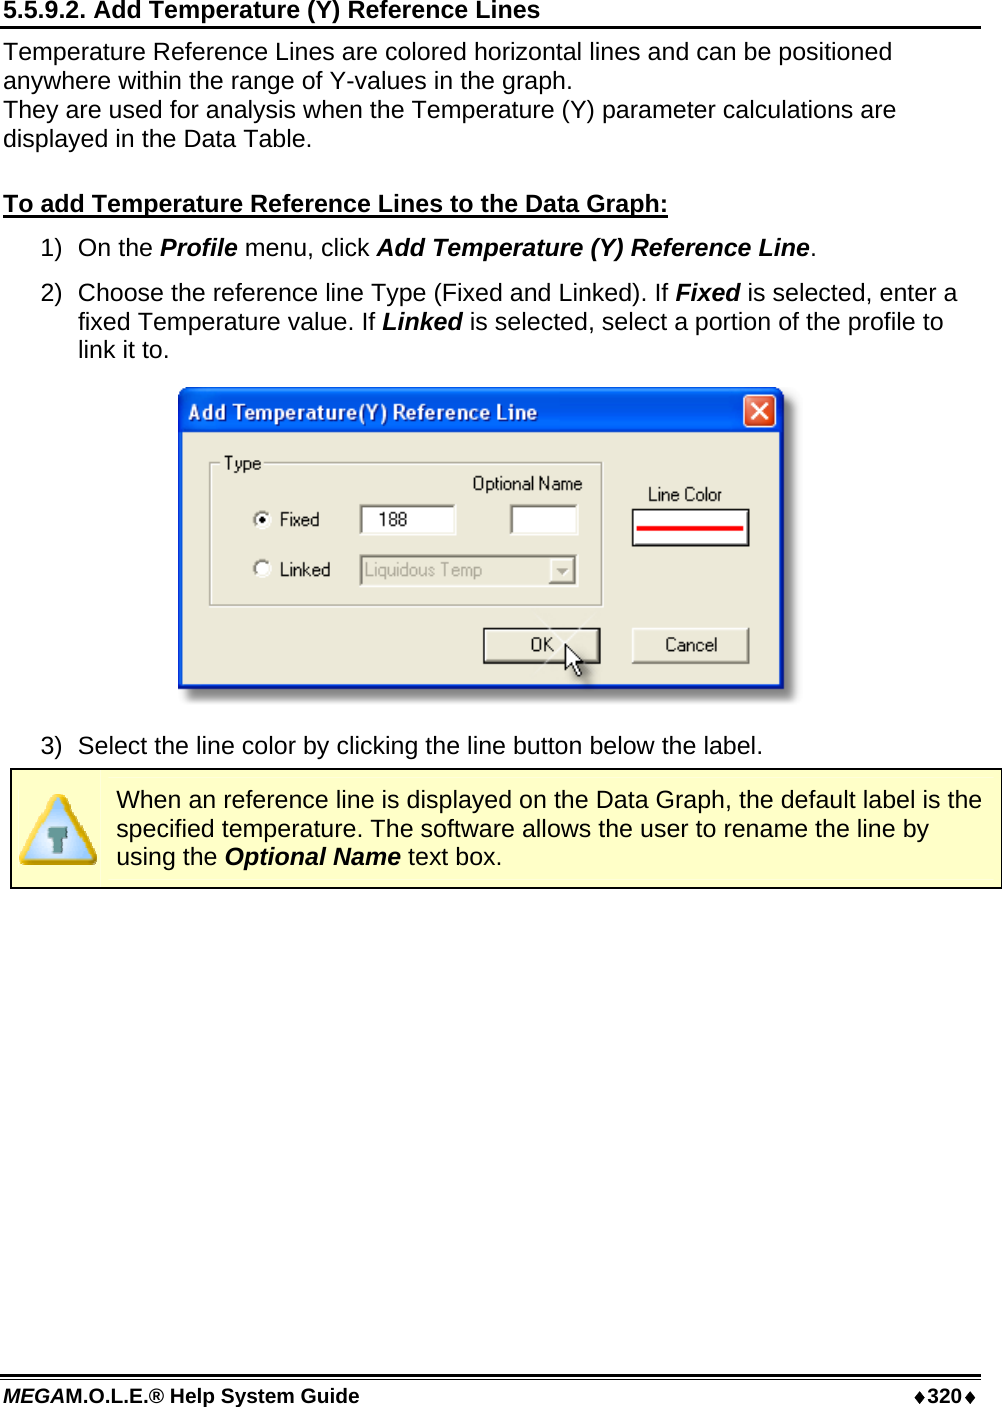


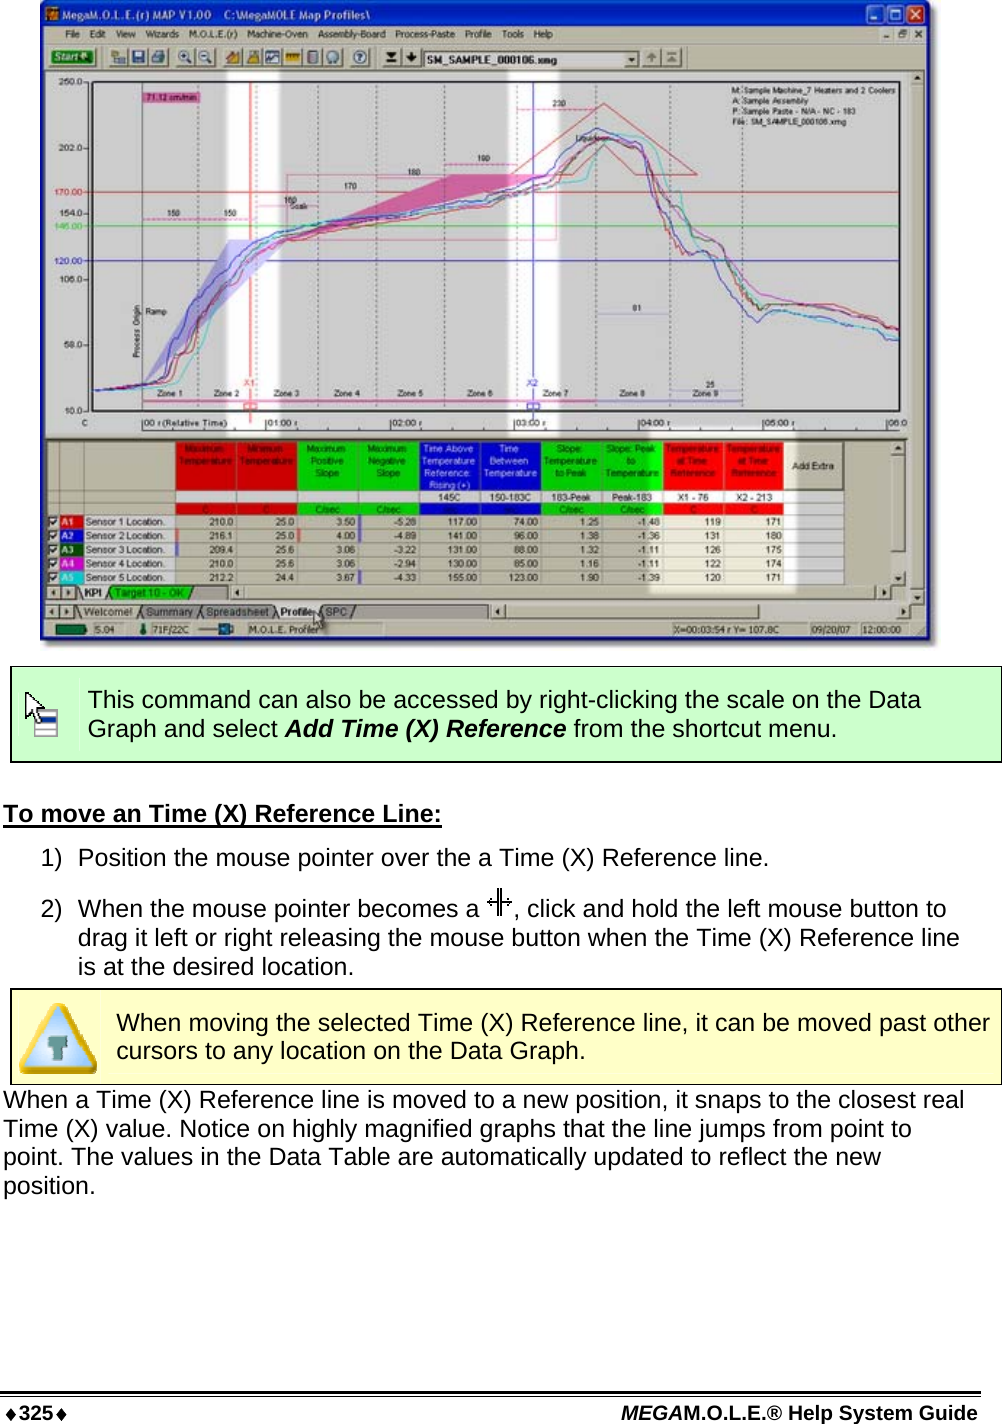

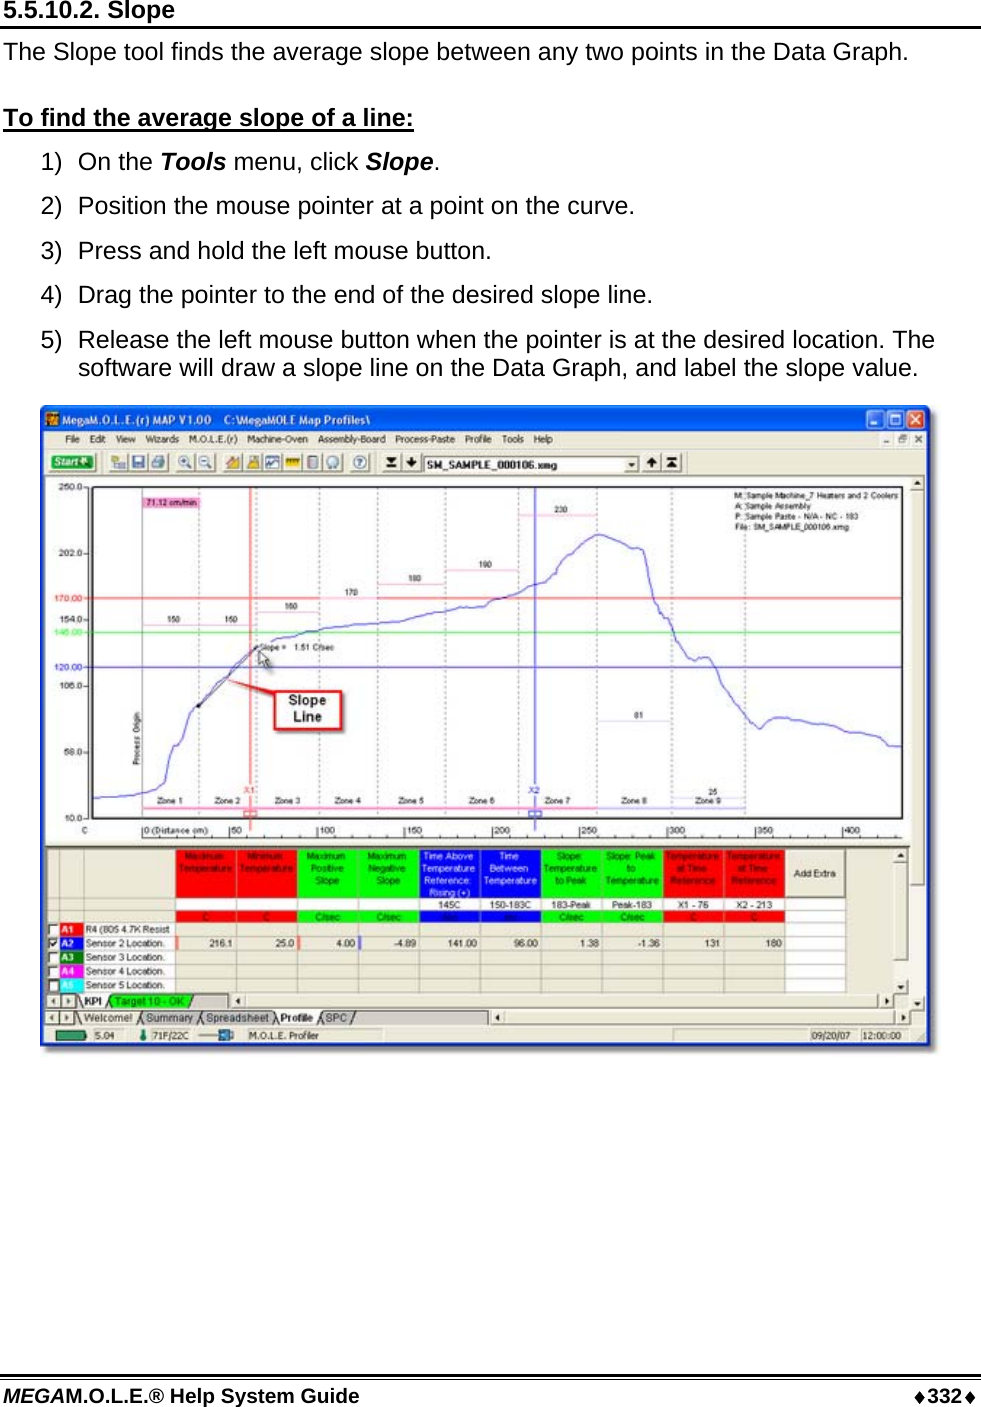
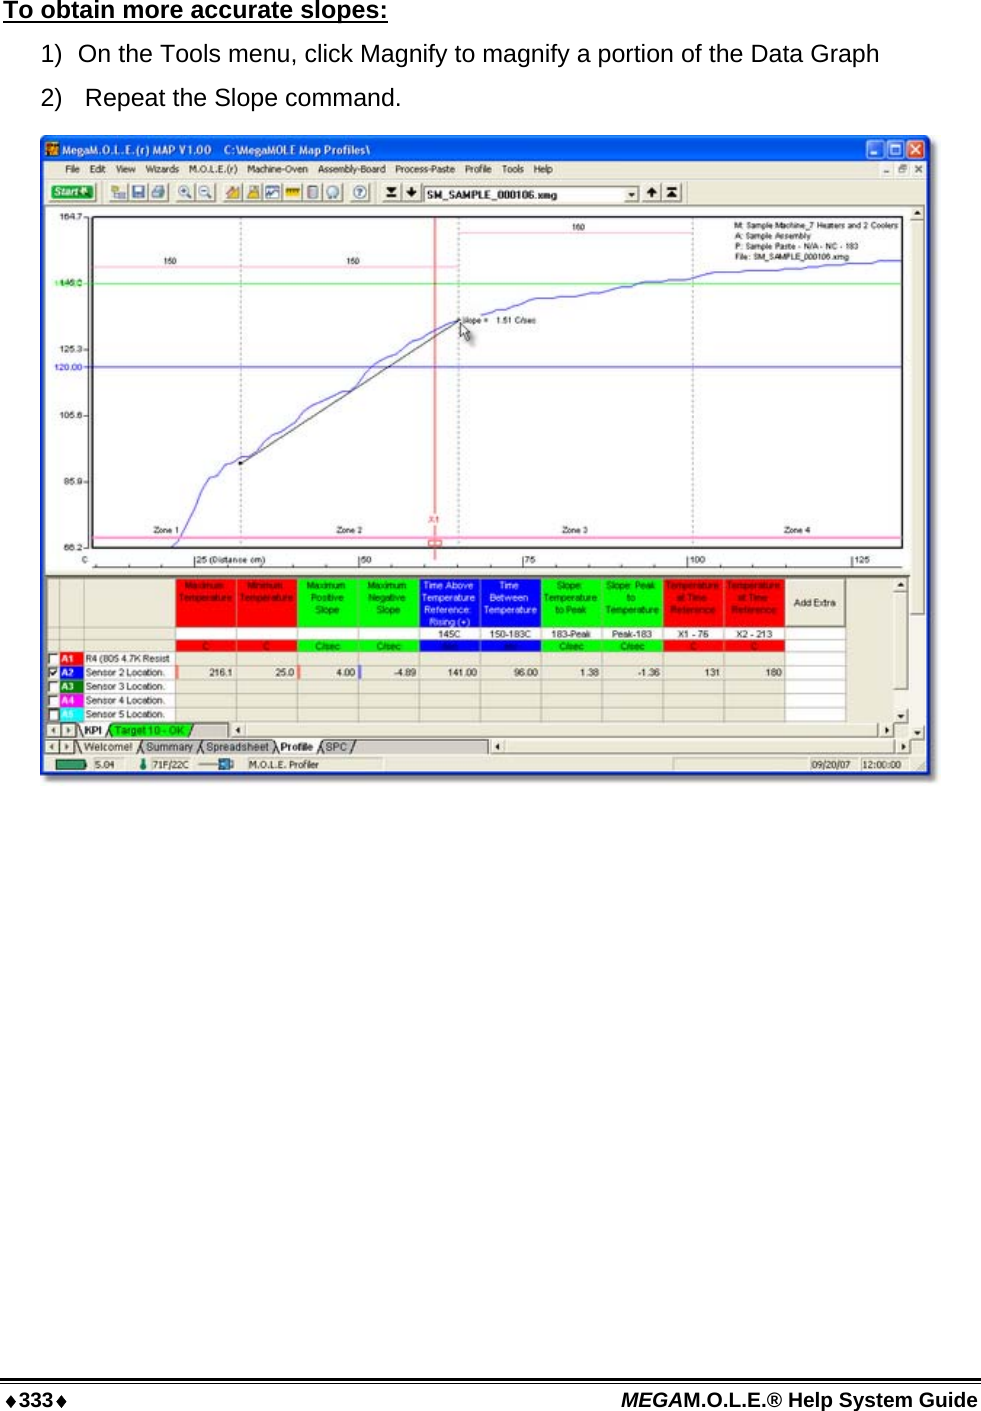
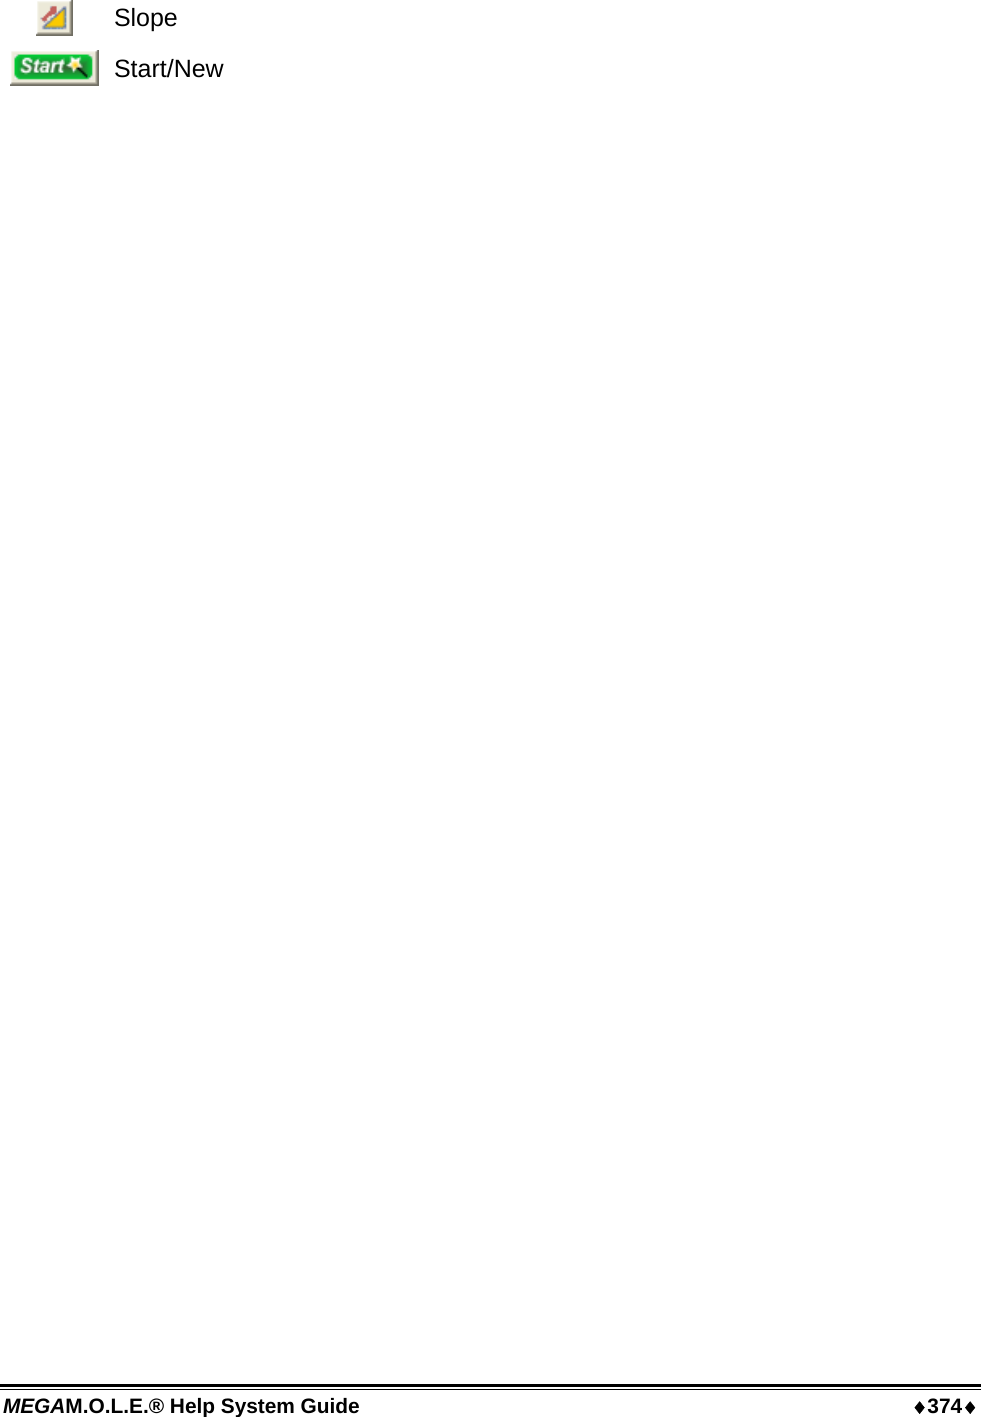
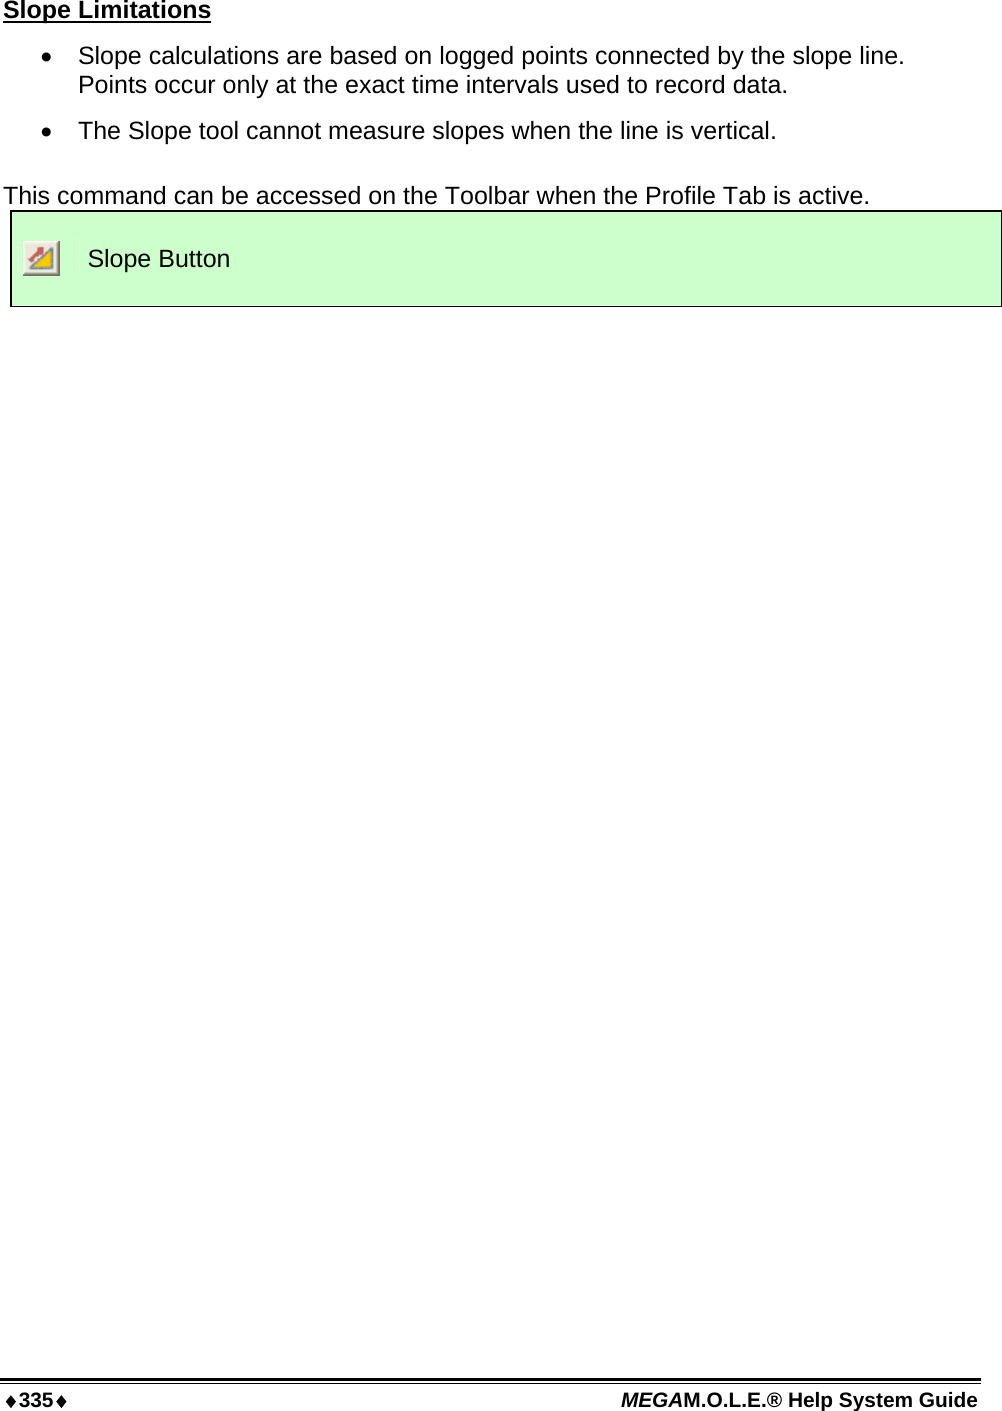
![MEGAM.O.L.E.® Help System Guide ♦334♦ To remove a slope line from the Data Graph: 1) Using the mouse pointer, select the object on the Data Graph by clicking it once. The object trackers will then become bold indicating that it has been selected. 2) Press the [Delete] key on the keyboard to remove the object. Slope Applications • Use the Slope tool to find the average slope between any two points on the graph. Longer slope lines tend to produce more accurate slope calculations. • The Slope tool can be used to compare actual data with ideal conditions by drawing a line with a known slope (to represent the ideal condition) beside a portion of a Data Plot.](https://usermanual.wiki/Electronic-Controls-Design/E47-6342-45.User-Manual-part-3/User-Guide-937651-Page-86.png)

![♦337♦ MEGAM.O.L.E.® Help System Guide To remove the peak difference: 1) Using the mouse pointer, select the object on the Data Graph by clicking it once. The object trackers will then become bold indicating that it has been selected. 2) Press the [Delete] key on the keyboard to remove the object. This command can be accessed on the Toolbar when the Profile Tab is active. Peak Difference Button](https://usermanual.wiki/Electronic-Controls-Design/E47-6342-45.User-Manual-part-3/User-Guide-937651-Page-89.png)
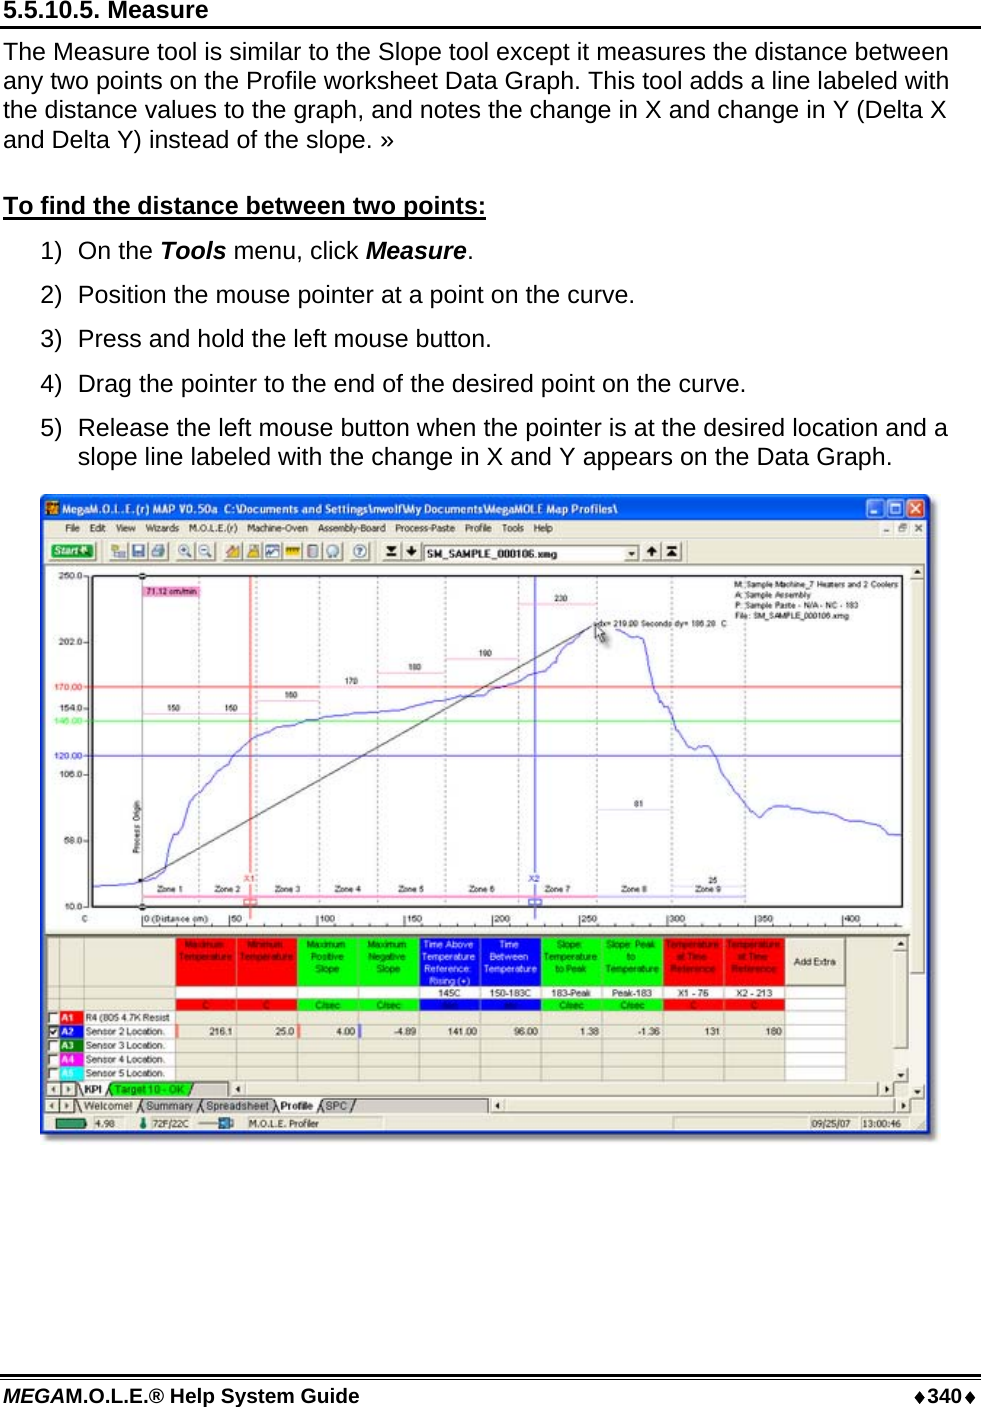
![♦341♦ MEGAM.O.L.E.® Help System Guide To obtain more accurate distances: 1) Magnify a portion of the Data Graph using the Magnify tool and repeat this procedure. To remove the annotated distance: 1) Using the mouse pointer, select the object on the Data Graph by clicking it once. The object trackers will then become bold indicating that it has been selected. 2) Press the [Delete] key on the keyboard to remove the object. This command can be accessed on the Toolbar when the Profile Tab is active. Measure Button](https://usermanual.wiki/Electronic-Controls-Design/E47-6342-45.User-Manual-part-3/User-Guide-937651-Page-93.png)
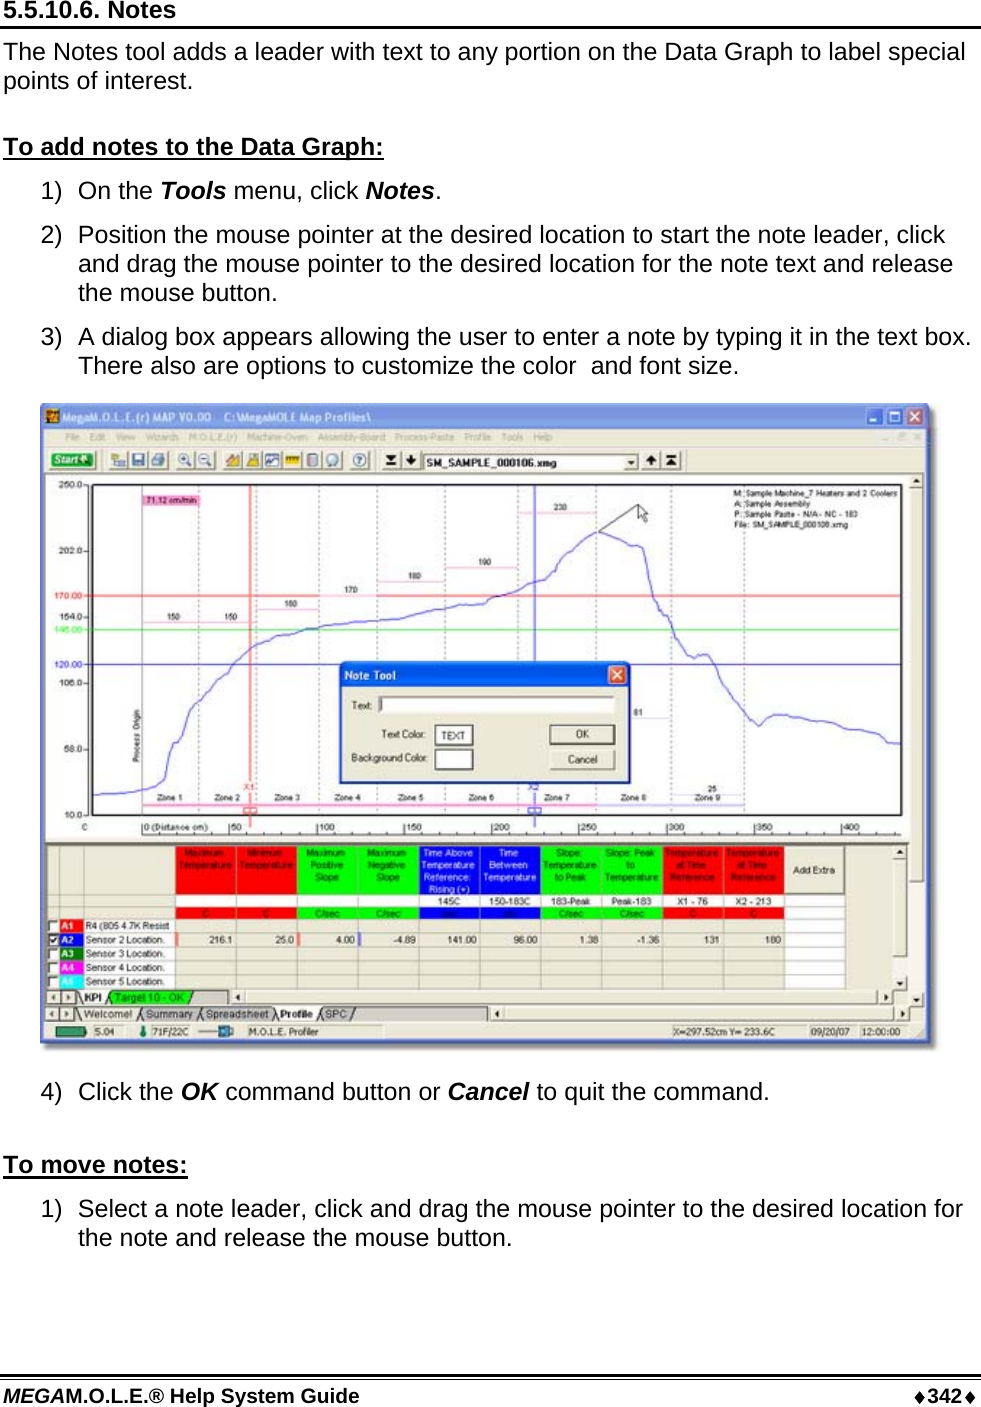
![♦343♦ MEGAM.O.L.E.® Help System Guide To remove notes: 1) Using the mouse pointer, select the object on the Data Graph by clicking it once. The object trackers will then become bold indicating that it has been selected. 2) Press the [Delete] key on the keyboard to remove the object. This command can be accessed on the Toolbar when the Profile Tab is active. Notes Button](https://usermanual.wiki/Electronic-Controls-Design/E47-6342-45.User-Manual-part-3/User-Guide-937651-Page-95.png)
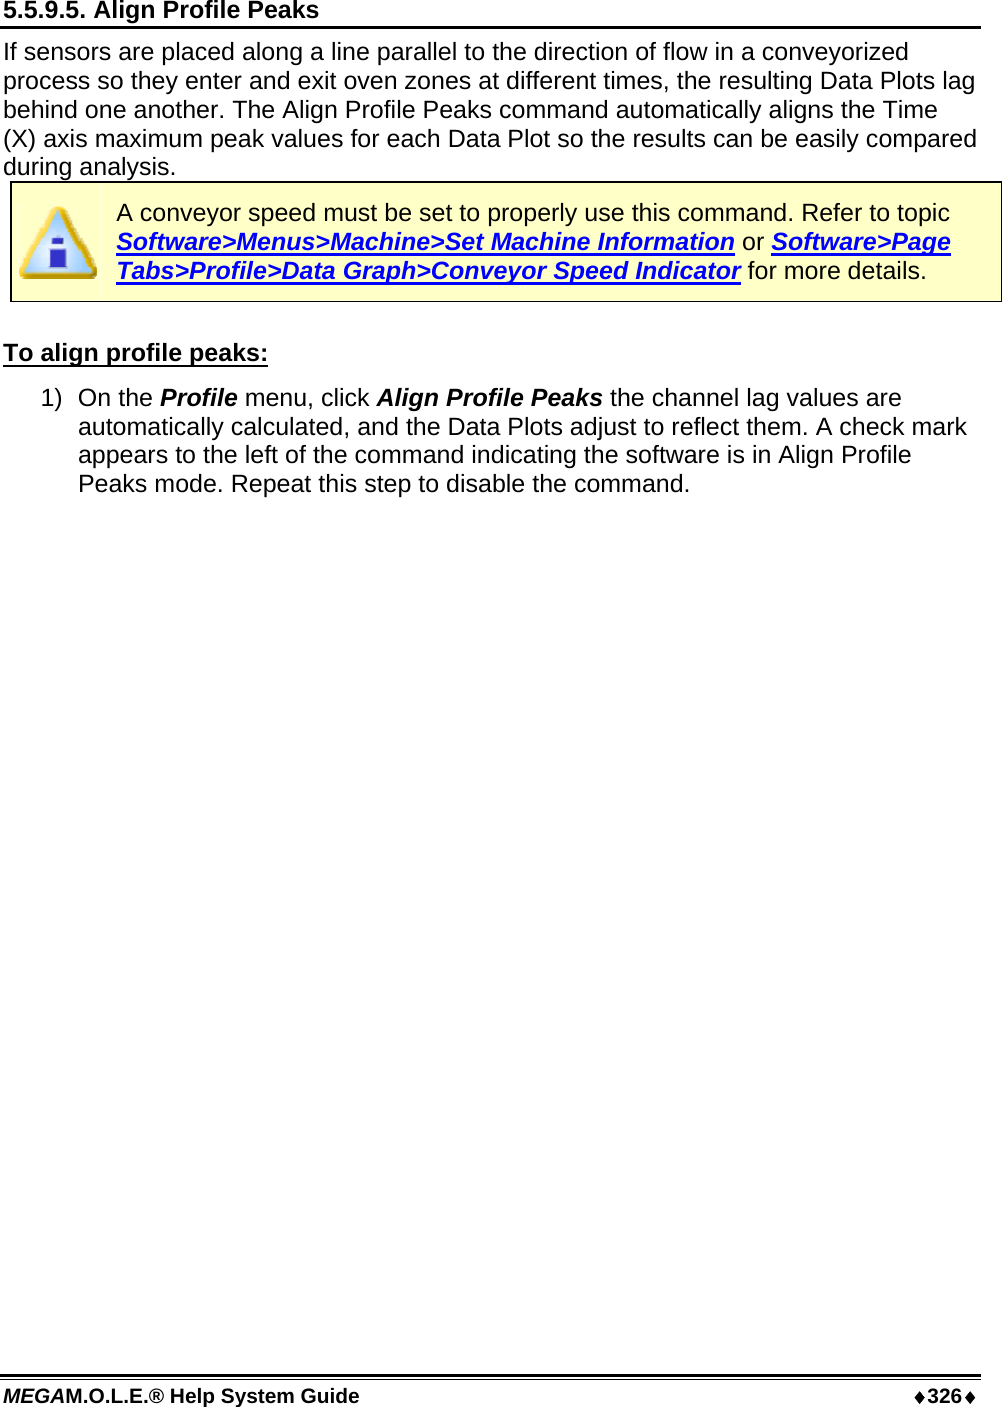
![♦349♦ MEGAM.O.L.E.® Help System Guide 5.5.11.1. Help The Help Index is a complete reference tool that can be used at any time. To launch the help system: 1) On the Help menu, click Help to launch the user’s help guide. You may now search for the help topic of your choice. This command can be accessed on the Toolbar and can also be used by pressing the shortcut key [F1]. Help Button](https://usermanual.wiki/Electronic-Controls-Design/E47-6342-45.User-Manual-part-3/User-Guide-937651-Page-101.png)