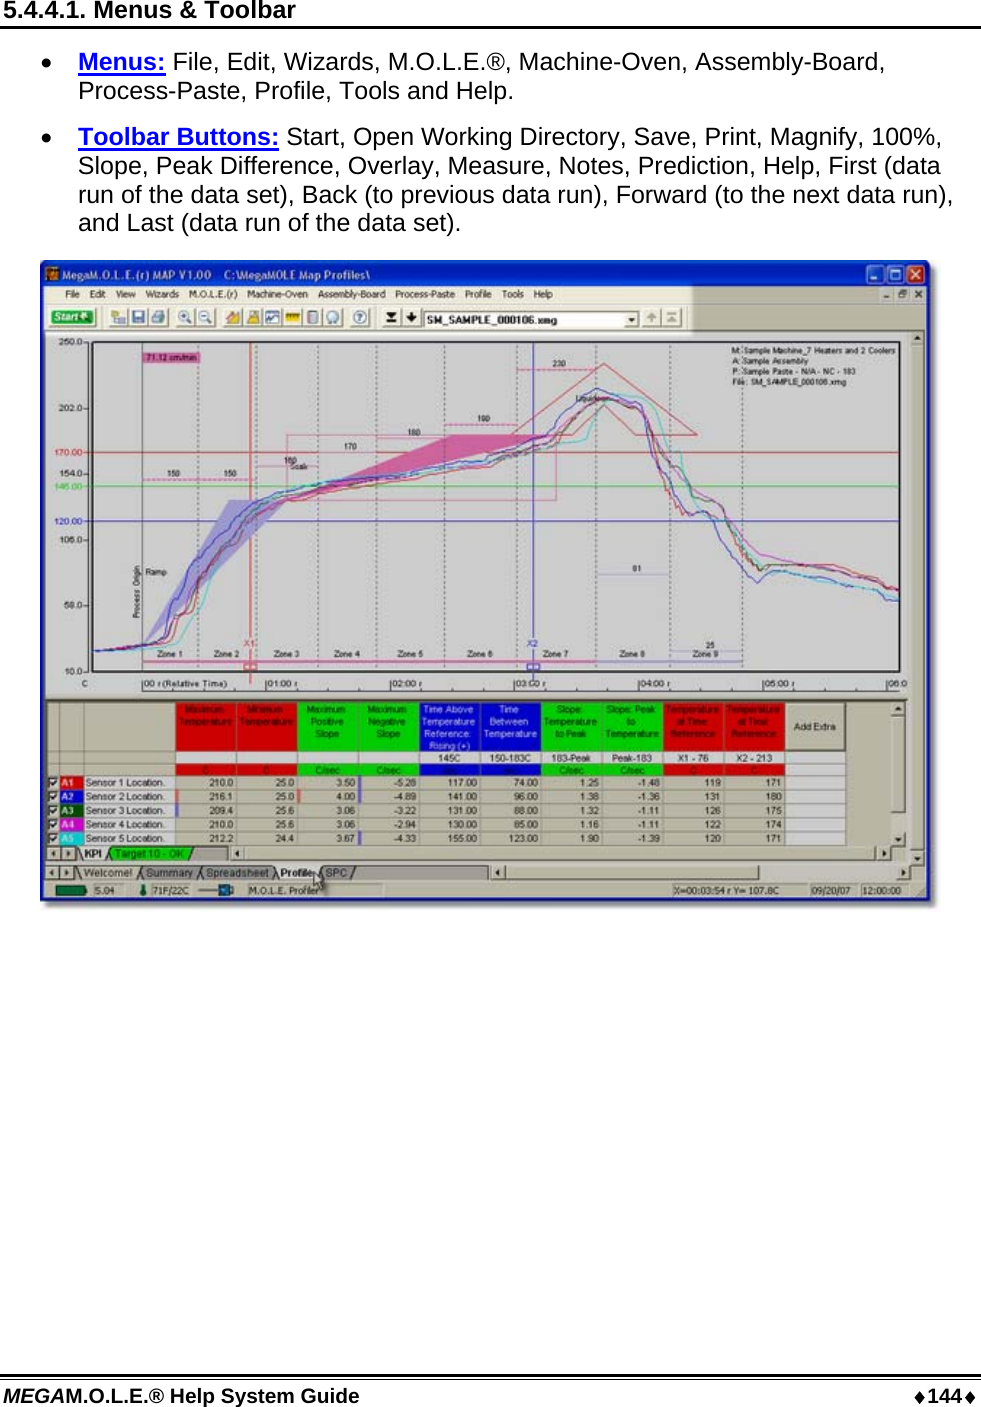
Electronic Controls Design E47-6342-45 MEGA M.O.L.E. User Manual A47 6342 00 2 10
Electronic Controls Design Inc MEGA M.O.L.E. A47 6342 00 2 10
Contents
- 1. Quick Reference Guide
- 2. User Manual part 1
- 3. User Manual part 2
- 4. User Manual part 3
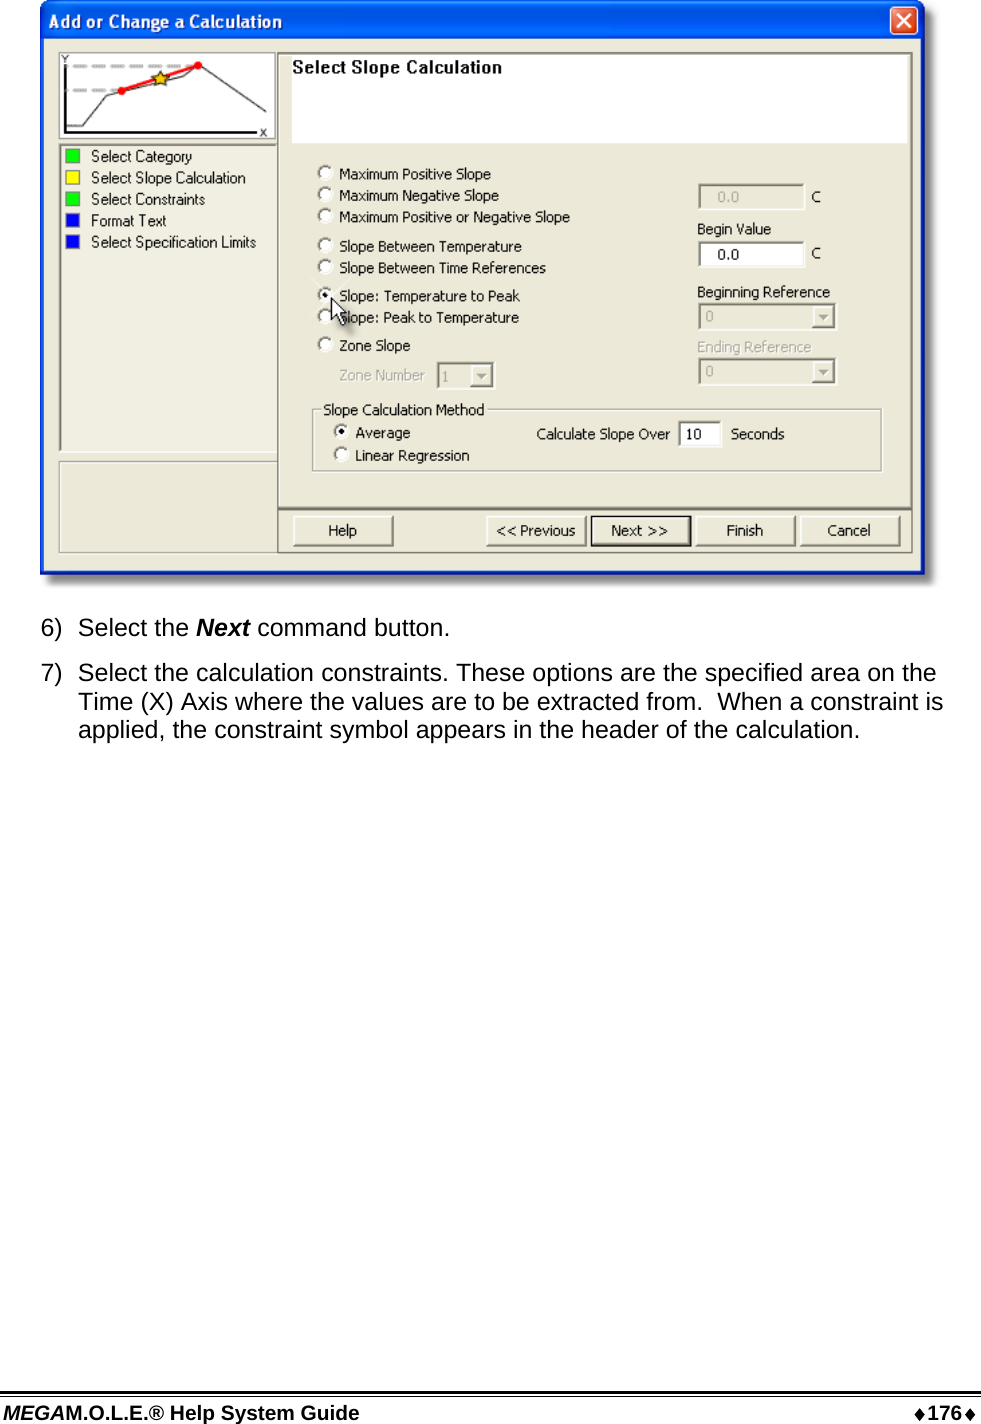
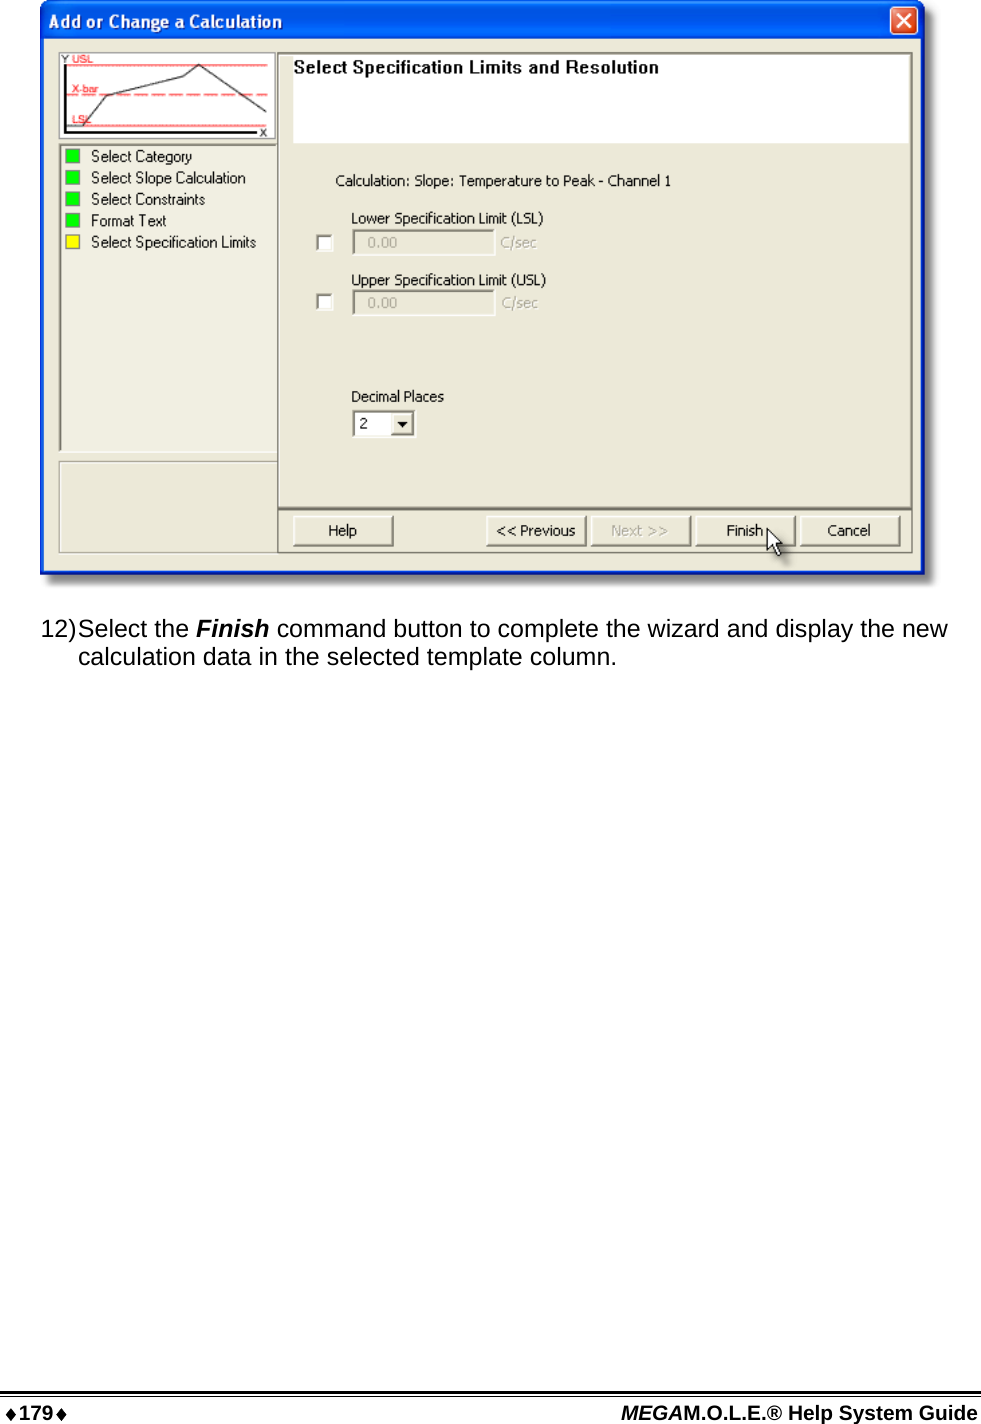
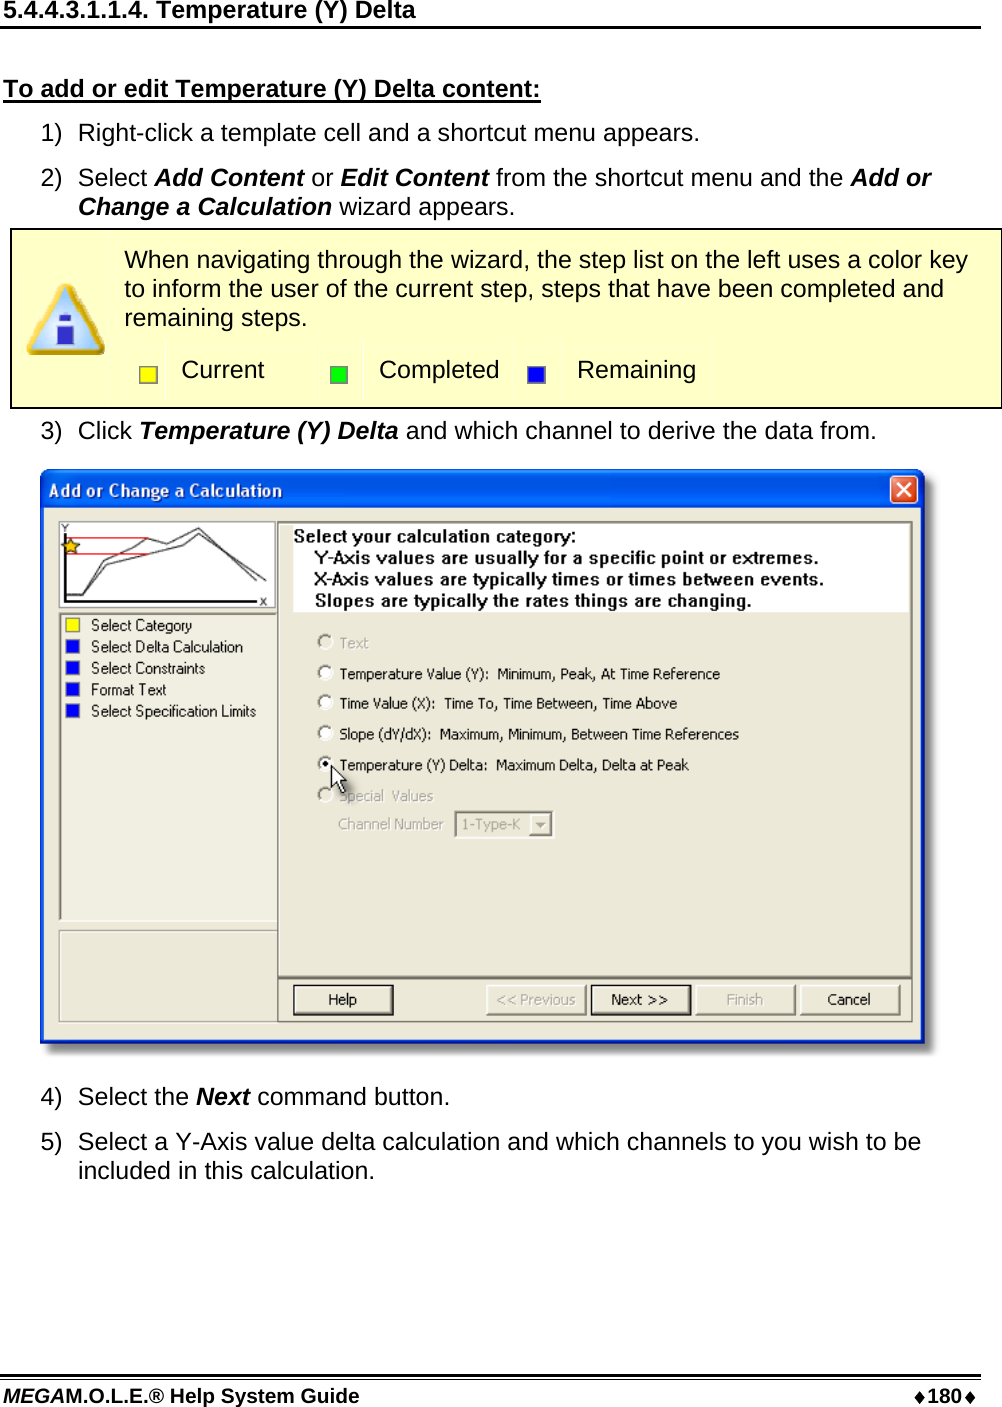
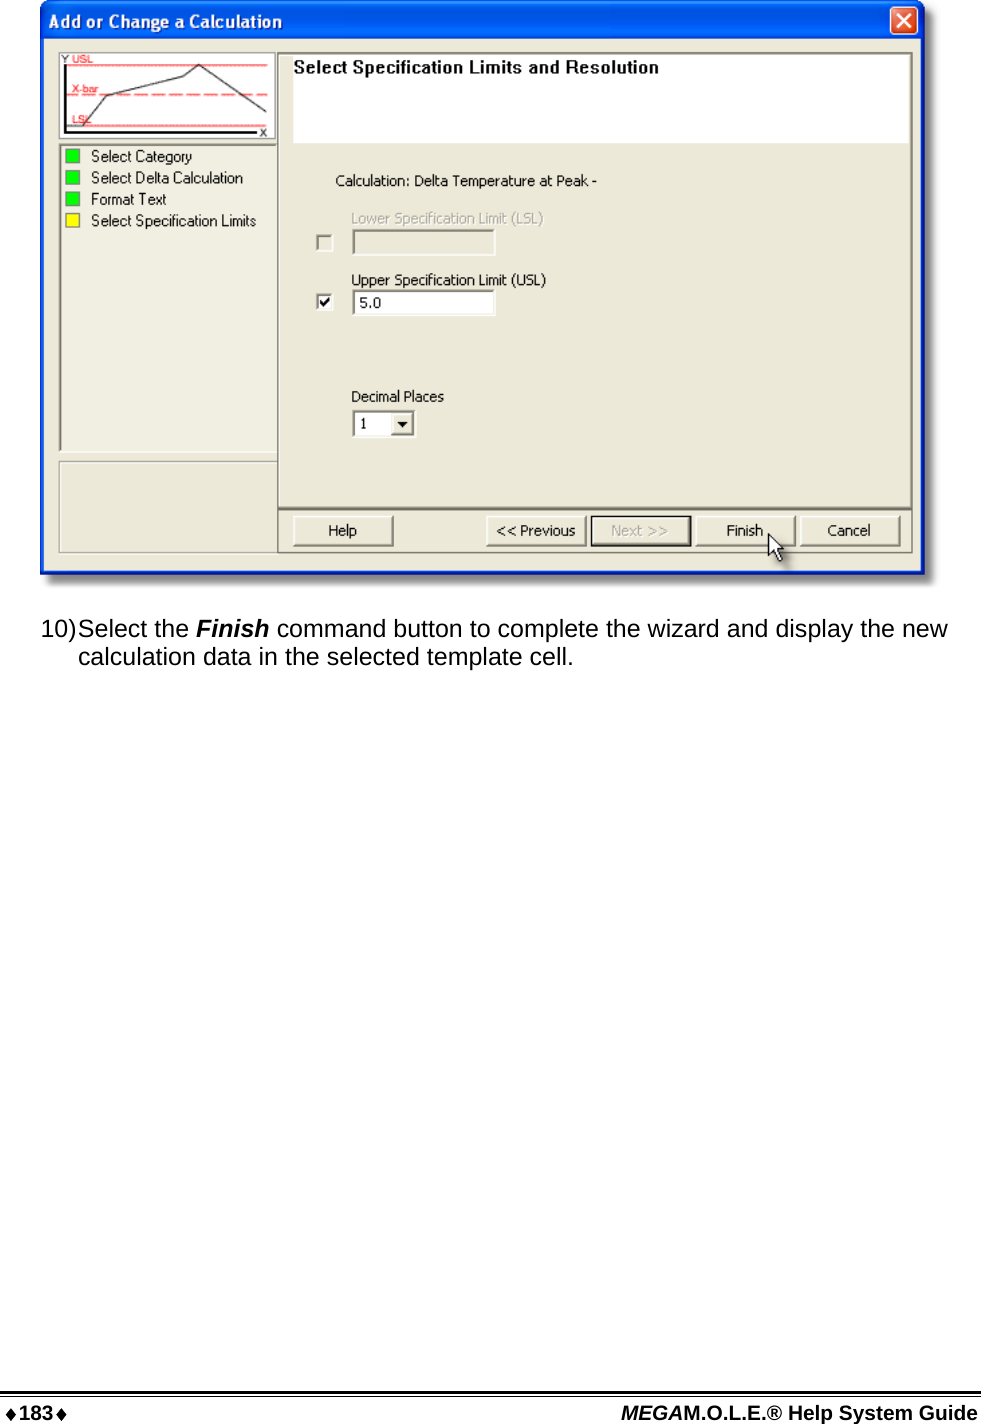
User Manual part 2

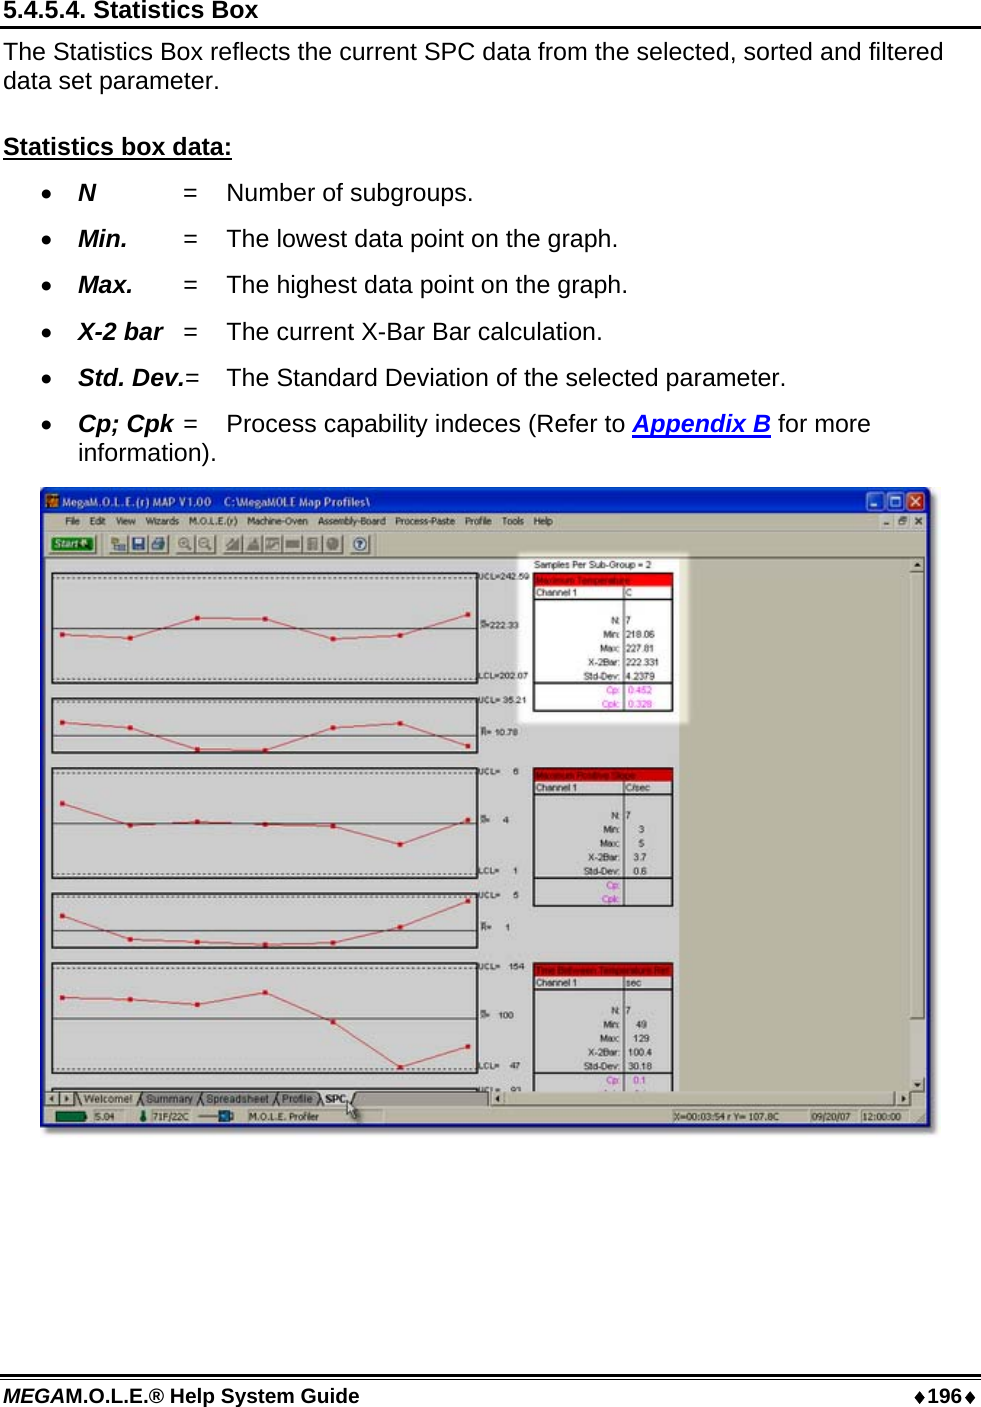
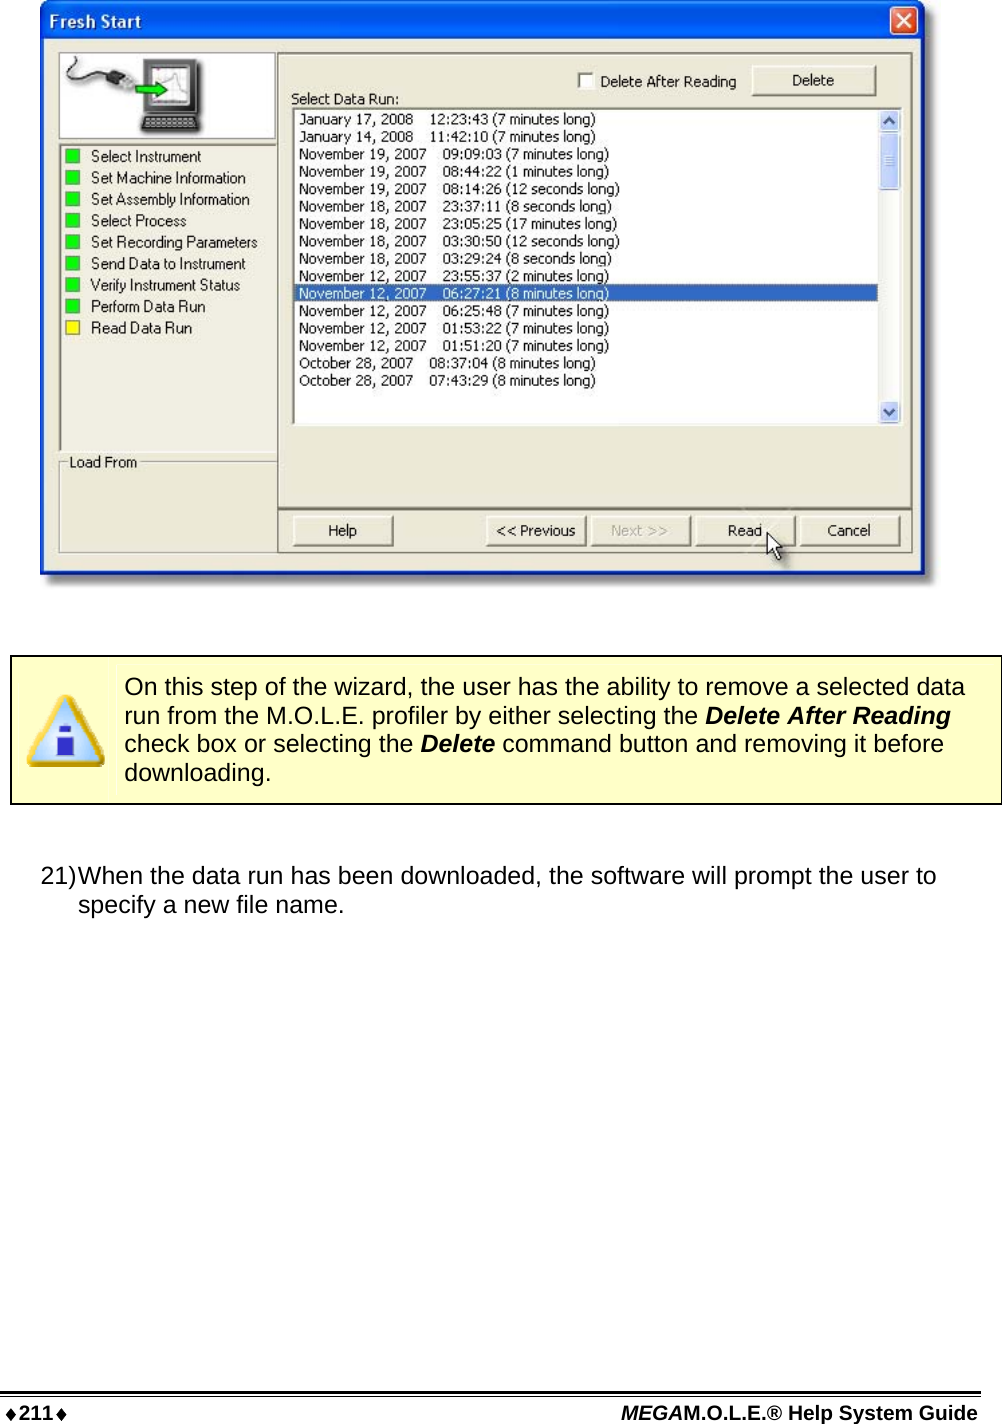
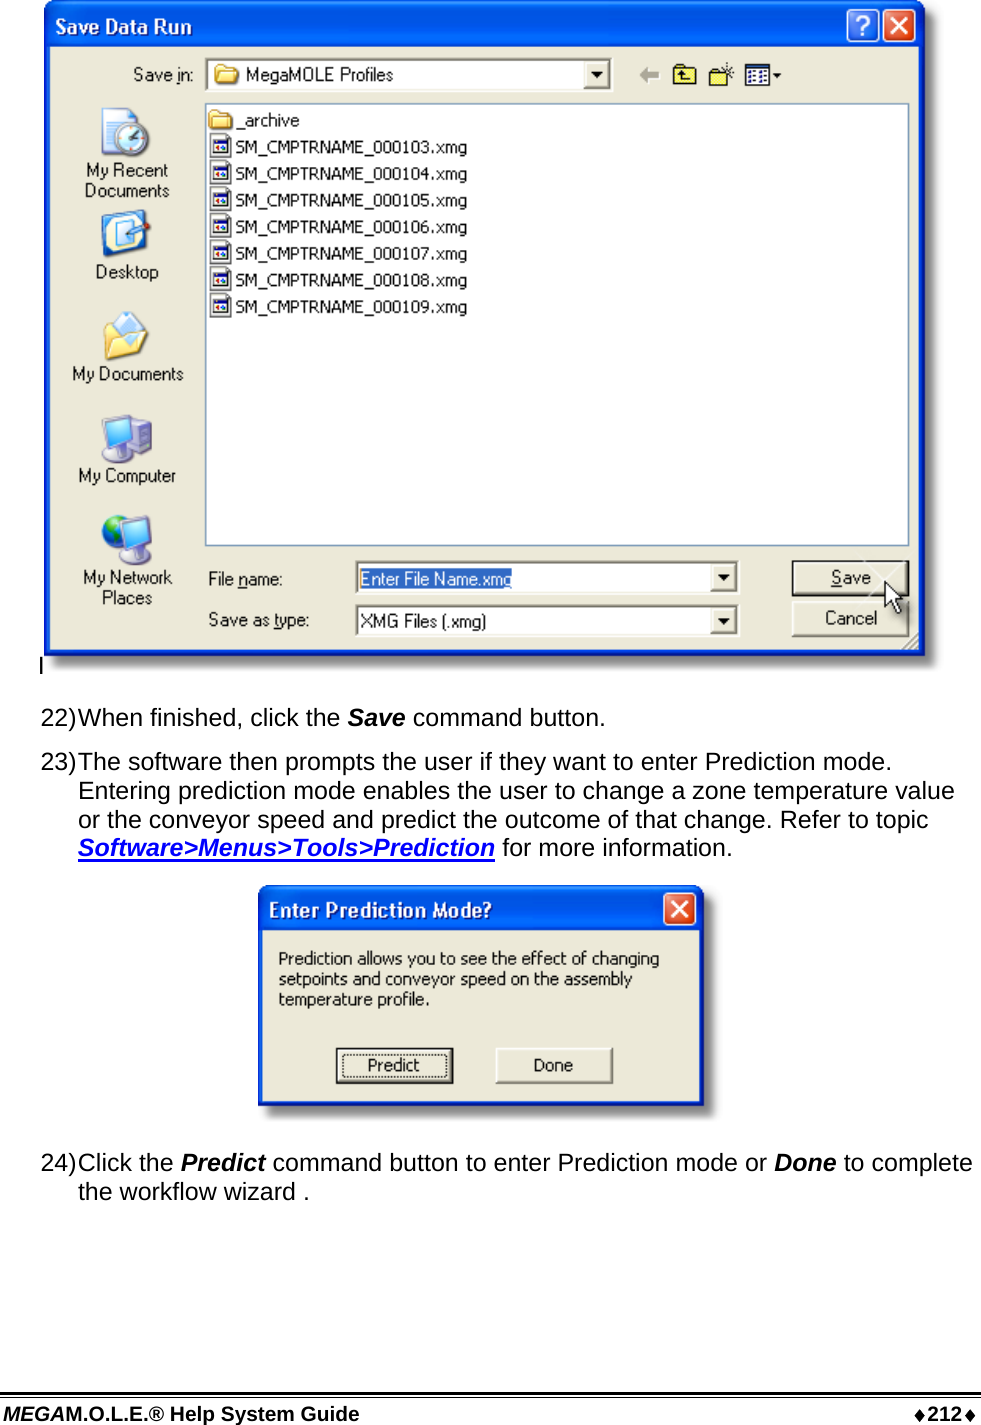
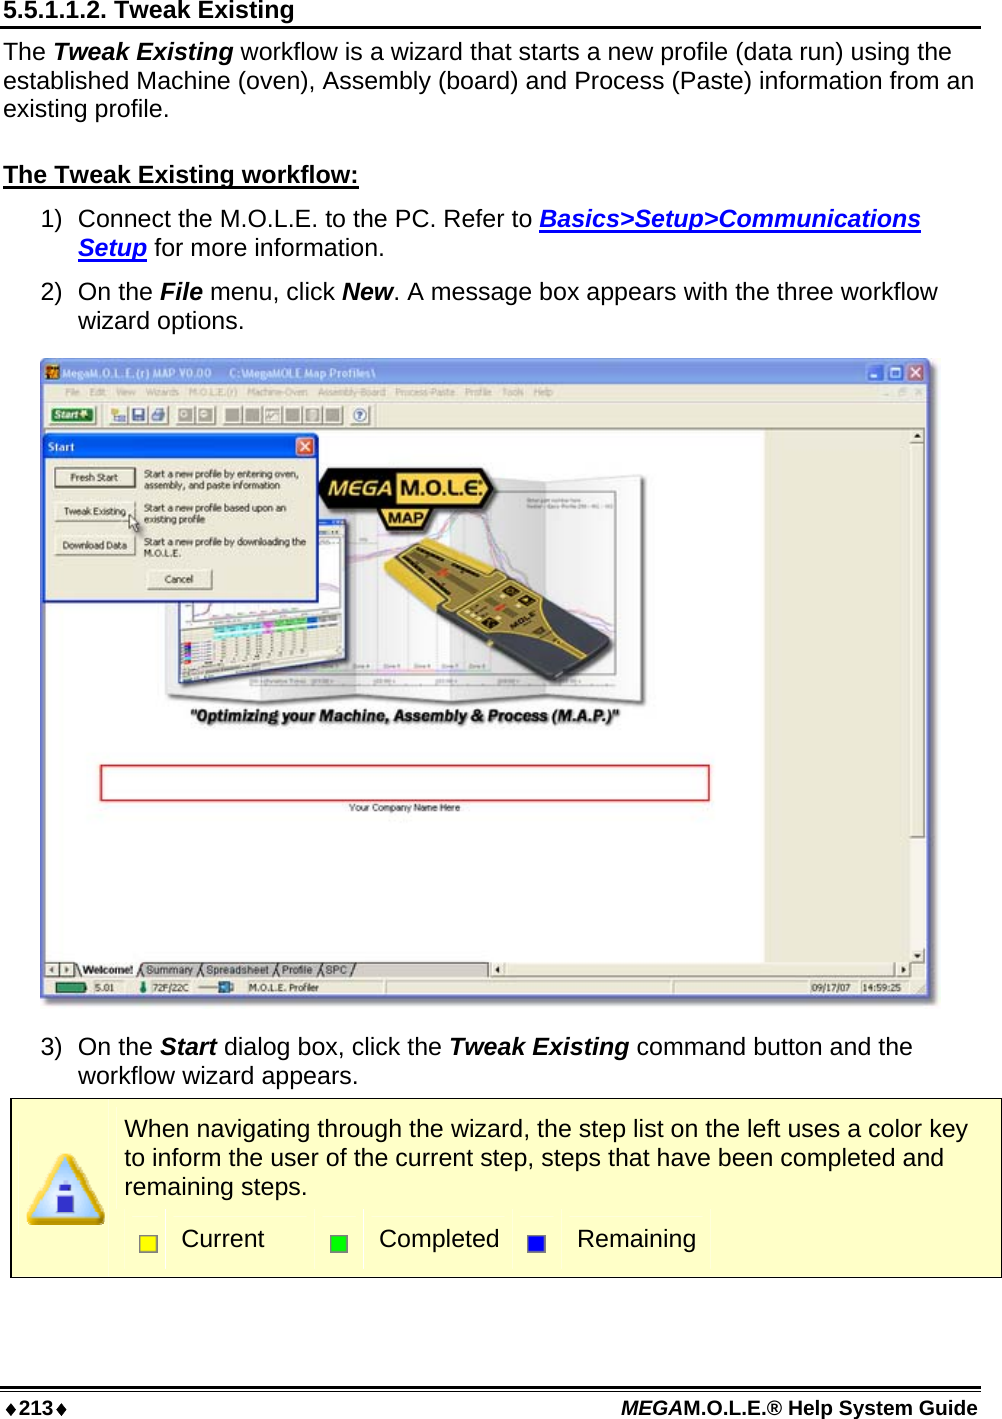
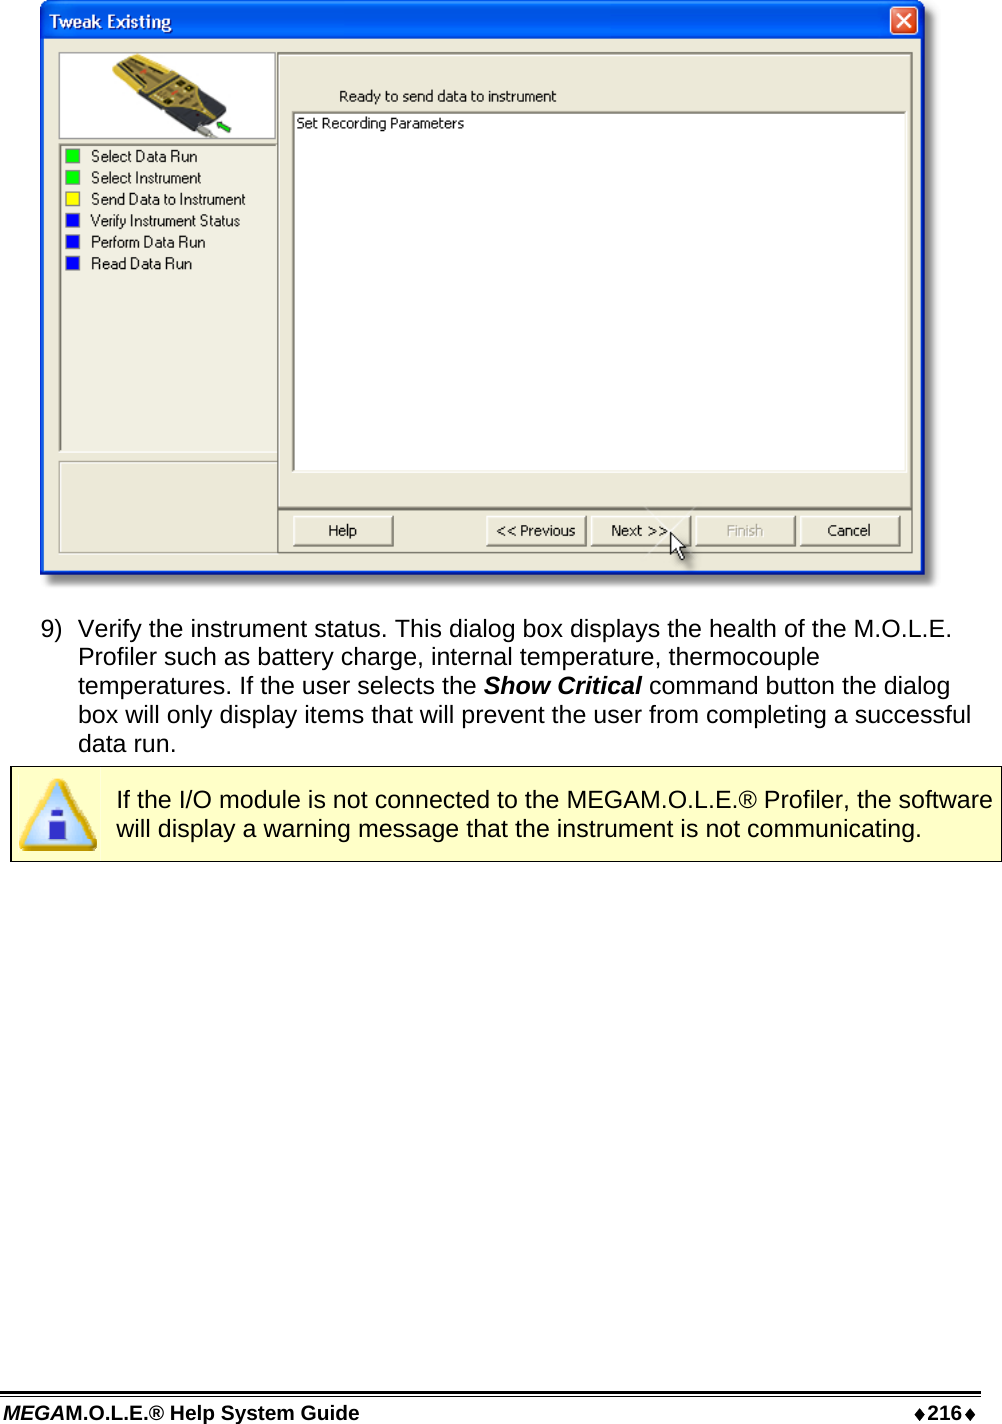
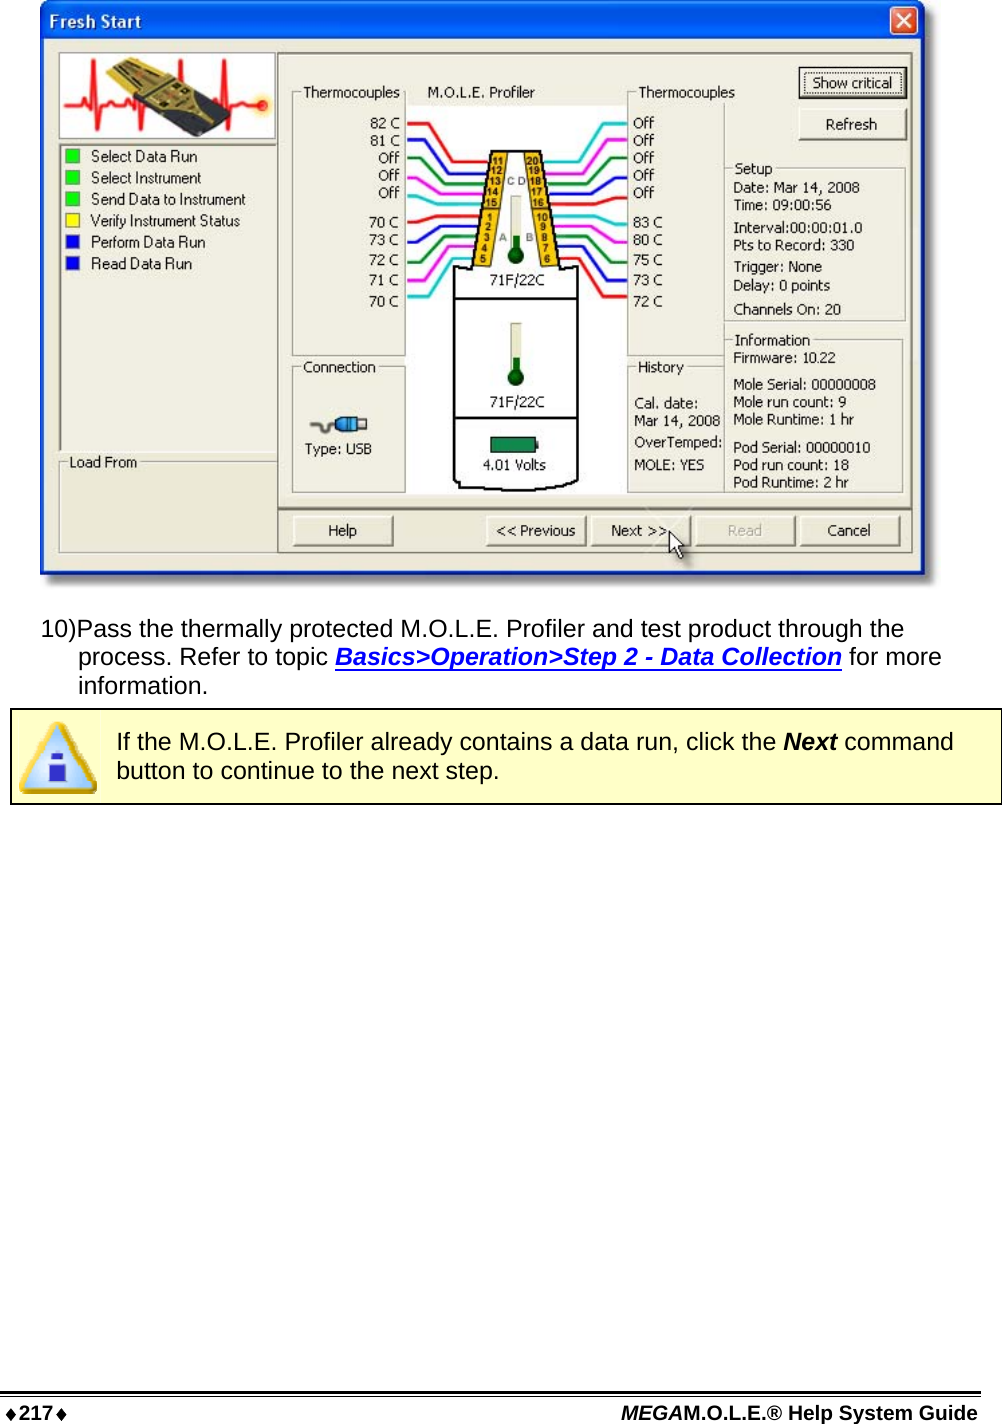
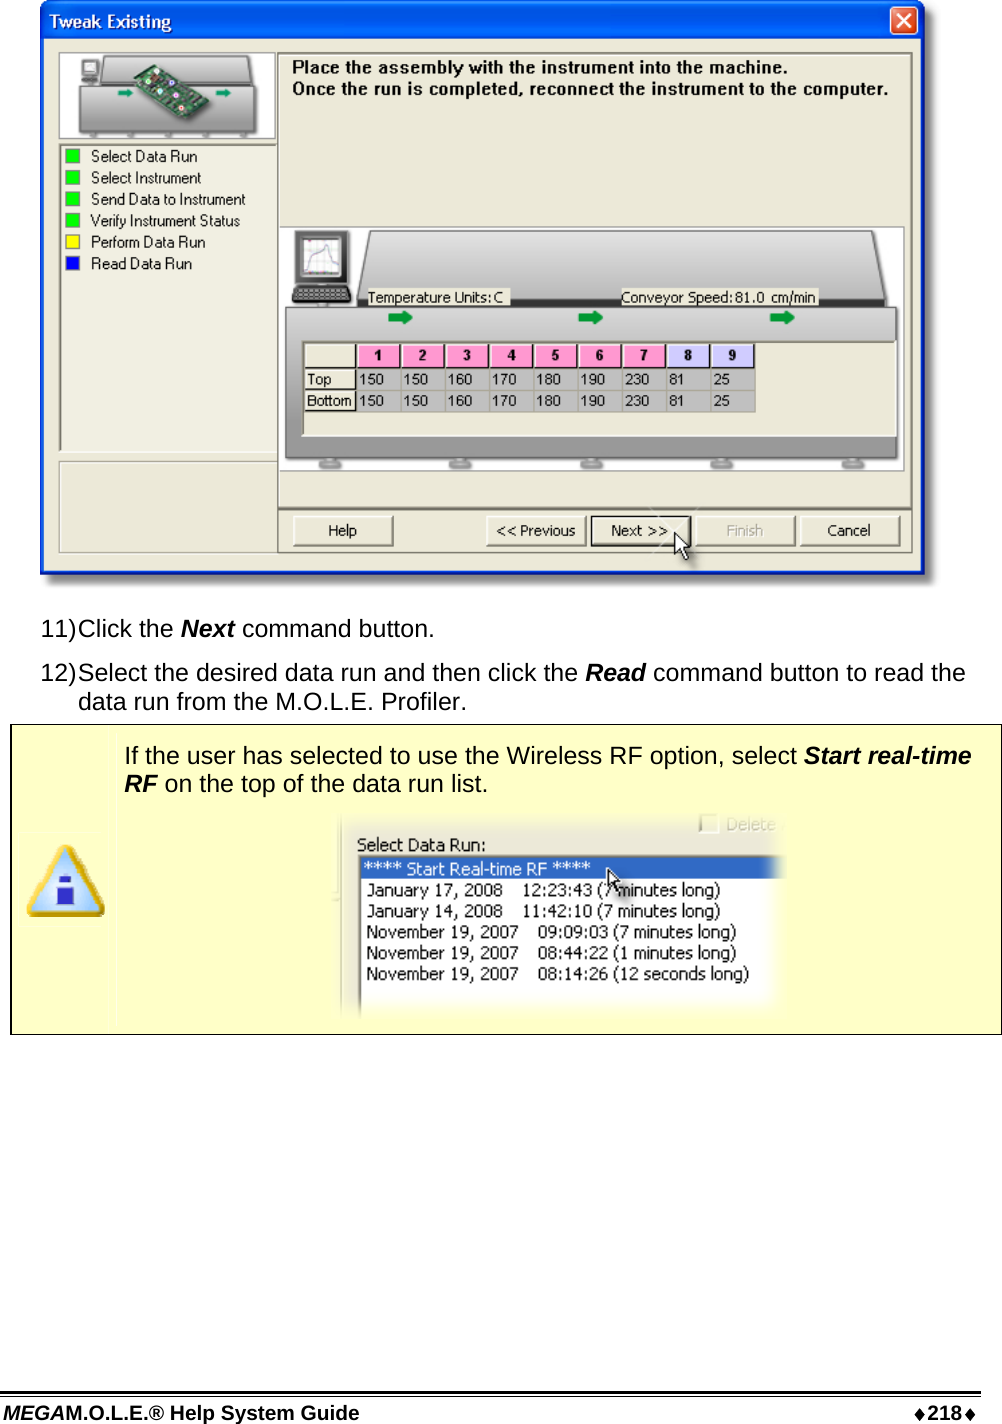
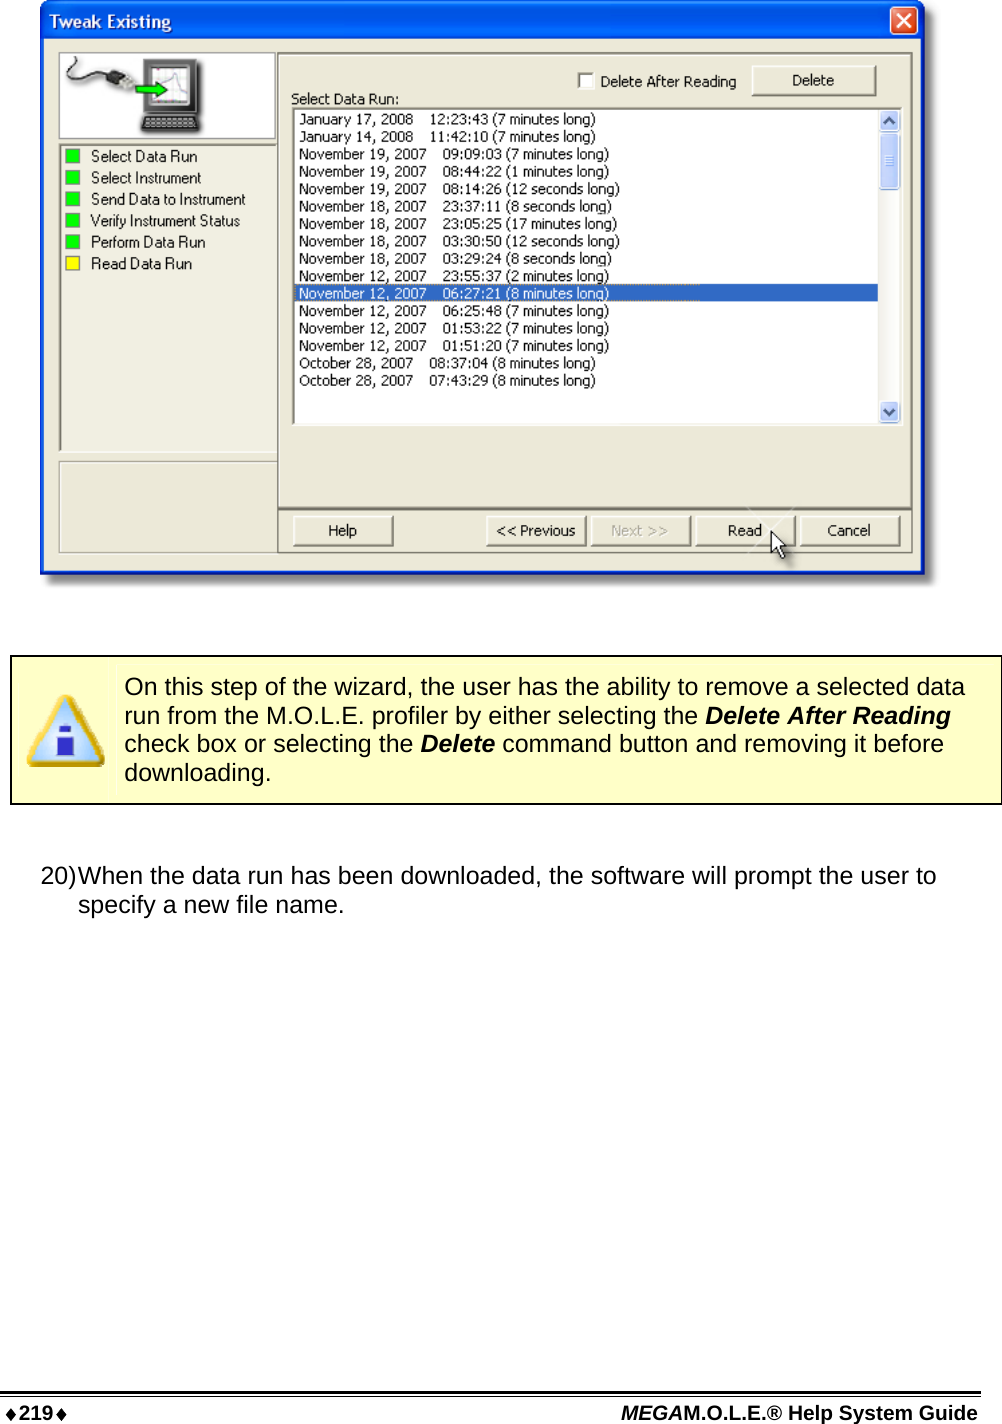
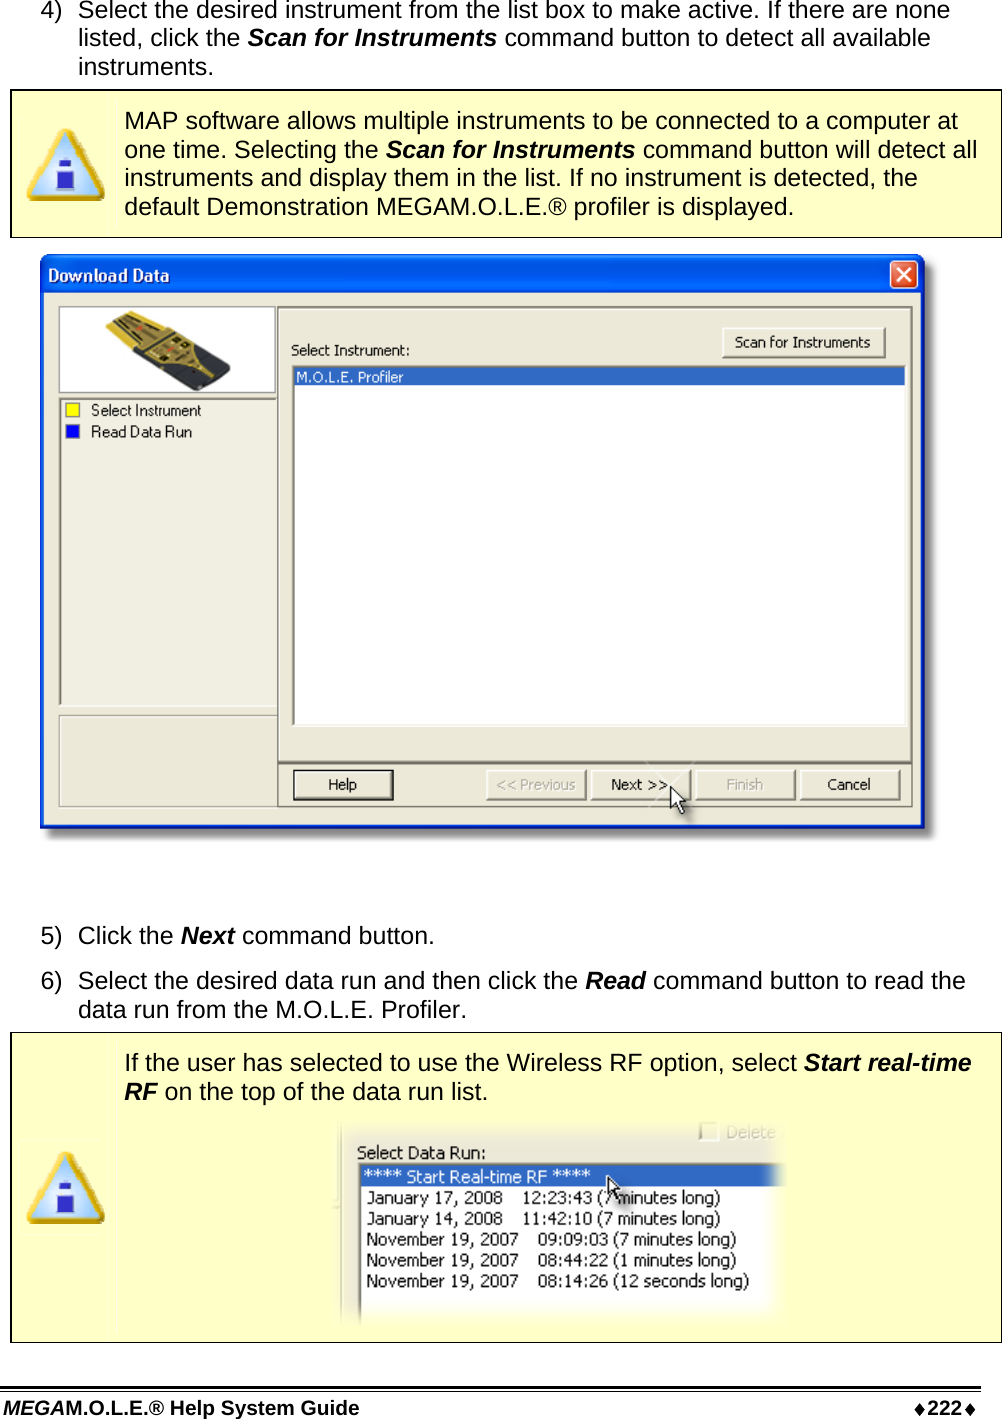
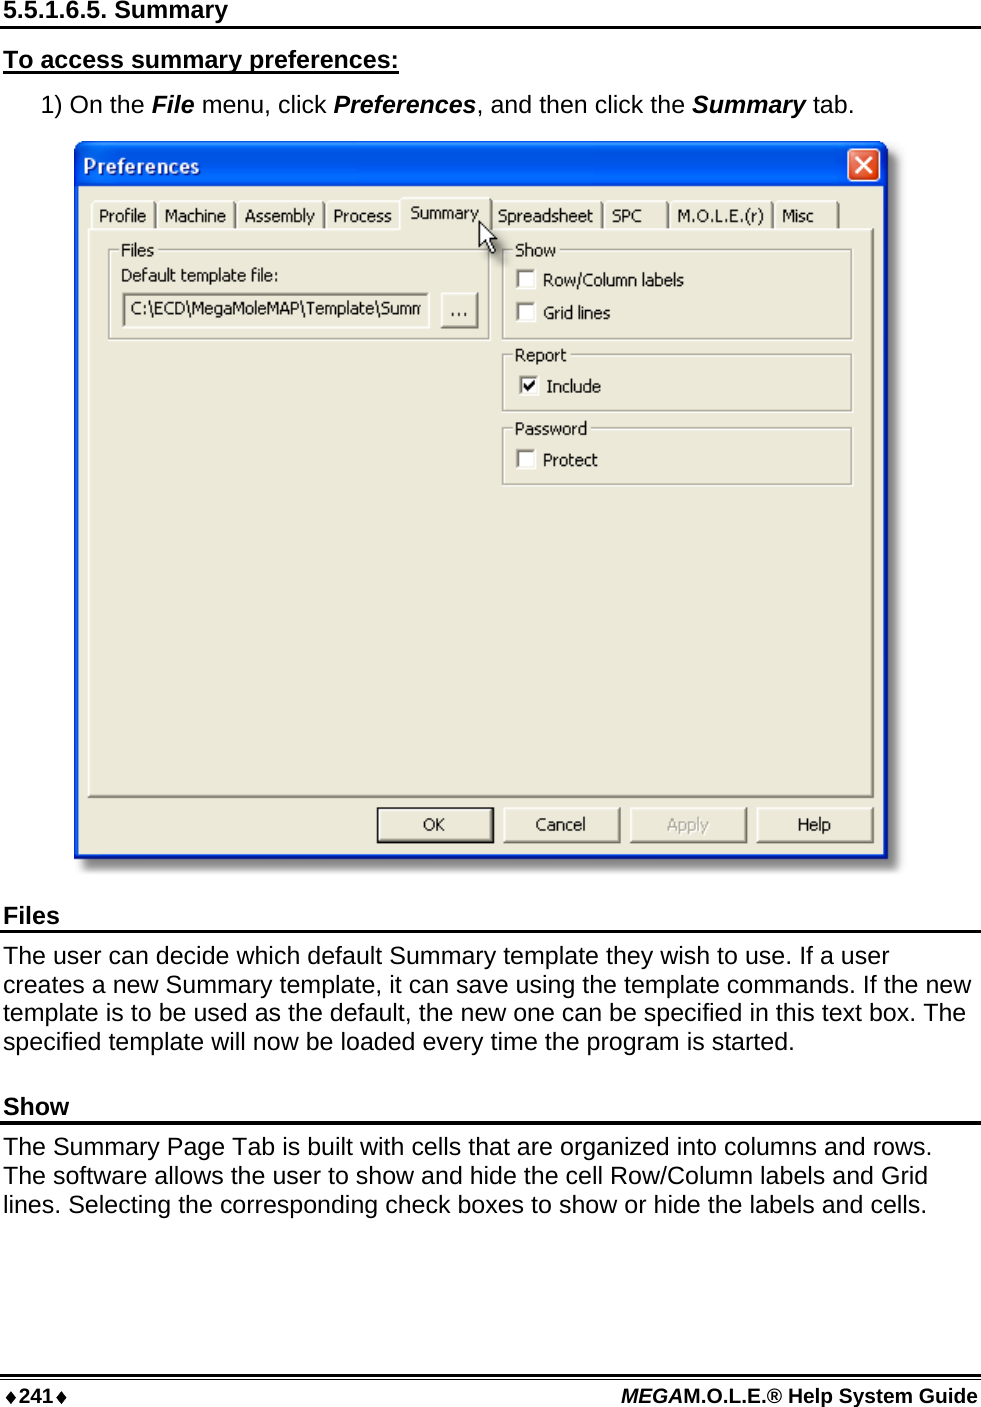
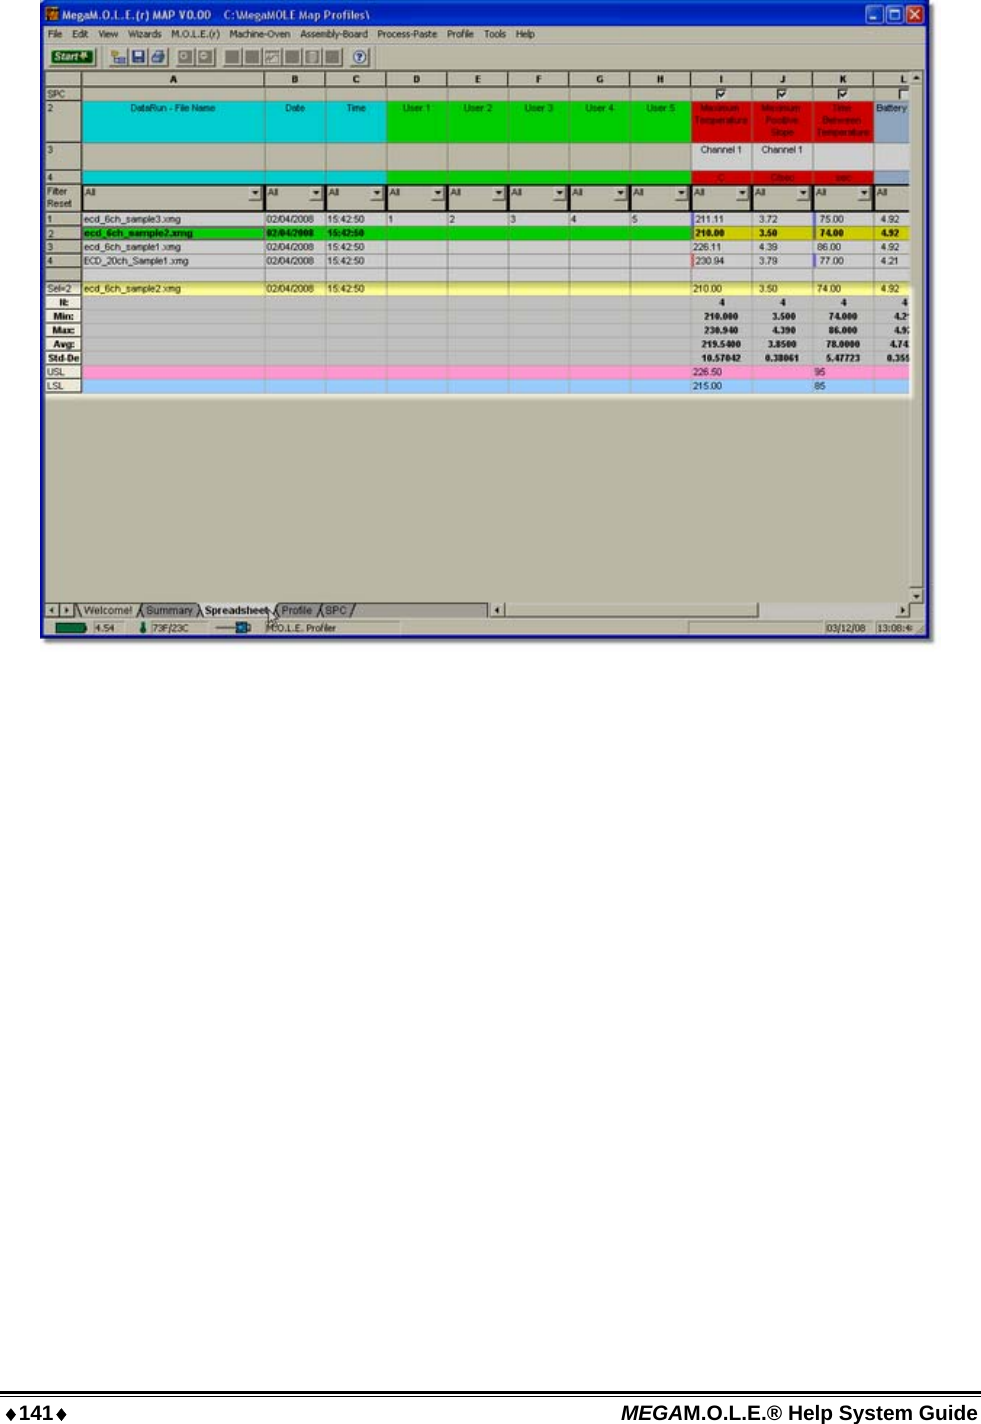
![♦135♦ MEGAM.O.L.E.® Help System Guide 5.4.3.5. Data Run Rows All of the data runs in the Selected working directory are listed on the Spreadsheet Page Tab as individual rows. The first data run uploaded or imported into the directory is on the bottom and the most recent data run is on the top. When any data run row is selected, all of the cells in the entire row are highlighted in purple and blue. The purple cells indicate that the cells can be modified and the blue cells indicate the data cannot be modified. When any individual data cell in a data run row is selected, all of the cells in the entire row are highlighted in green and yellow. The green cells indicate that the cells can be modified and the yellow cells indicate the data cannot be modified. When a data run row is selected, the data for that row will also be displayed in the Sel= row located at the bottom of the data run rows. This row allows the user to easily compare the selected data row to the statistics calculations located below the selected run row. Selected rows and columns can be “copied” by pressing keys [CTRL + C] and then “pasted” [Ctrl + V] into other applications. The data run rows can also be moved into any order desired. This is useful when the user wants to place similar data runs together. To change the order of the data run: 1) Select the number cell of a data run row with the mouse pointer. The row will then become highlighted in purple and blue. 2) Drag the row and drop it to a desired location.](https://usermanual.wiki/Electronic-Controls-Design/E47-6342-45.User-Manual-part-2/User-Guide-937650-Page-11.png)


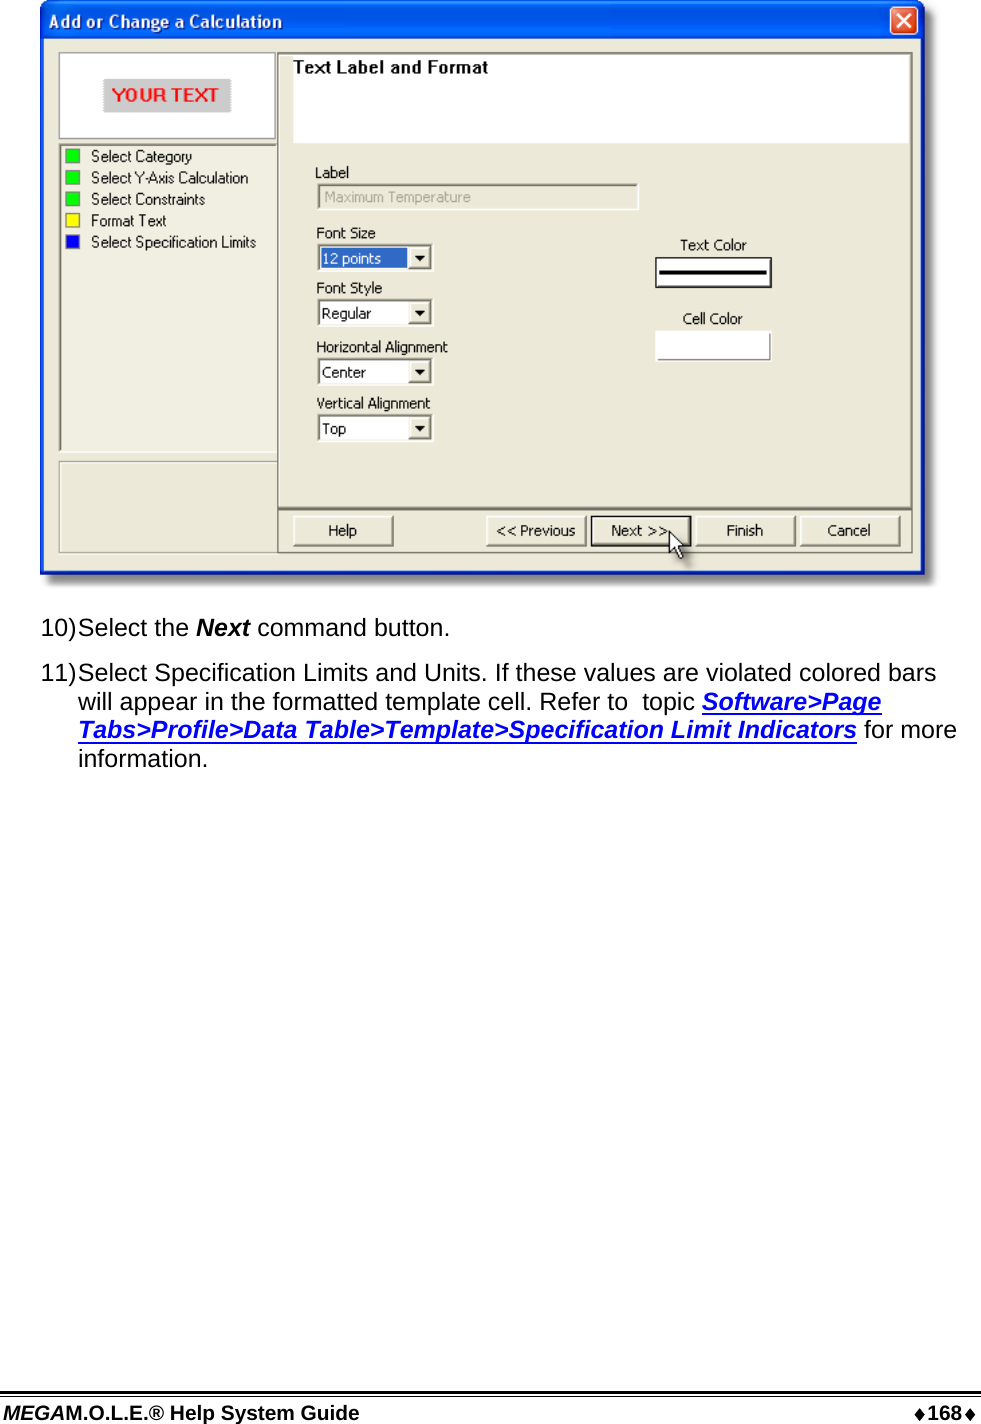
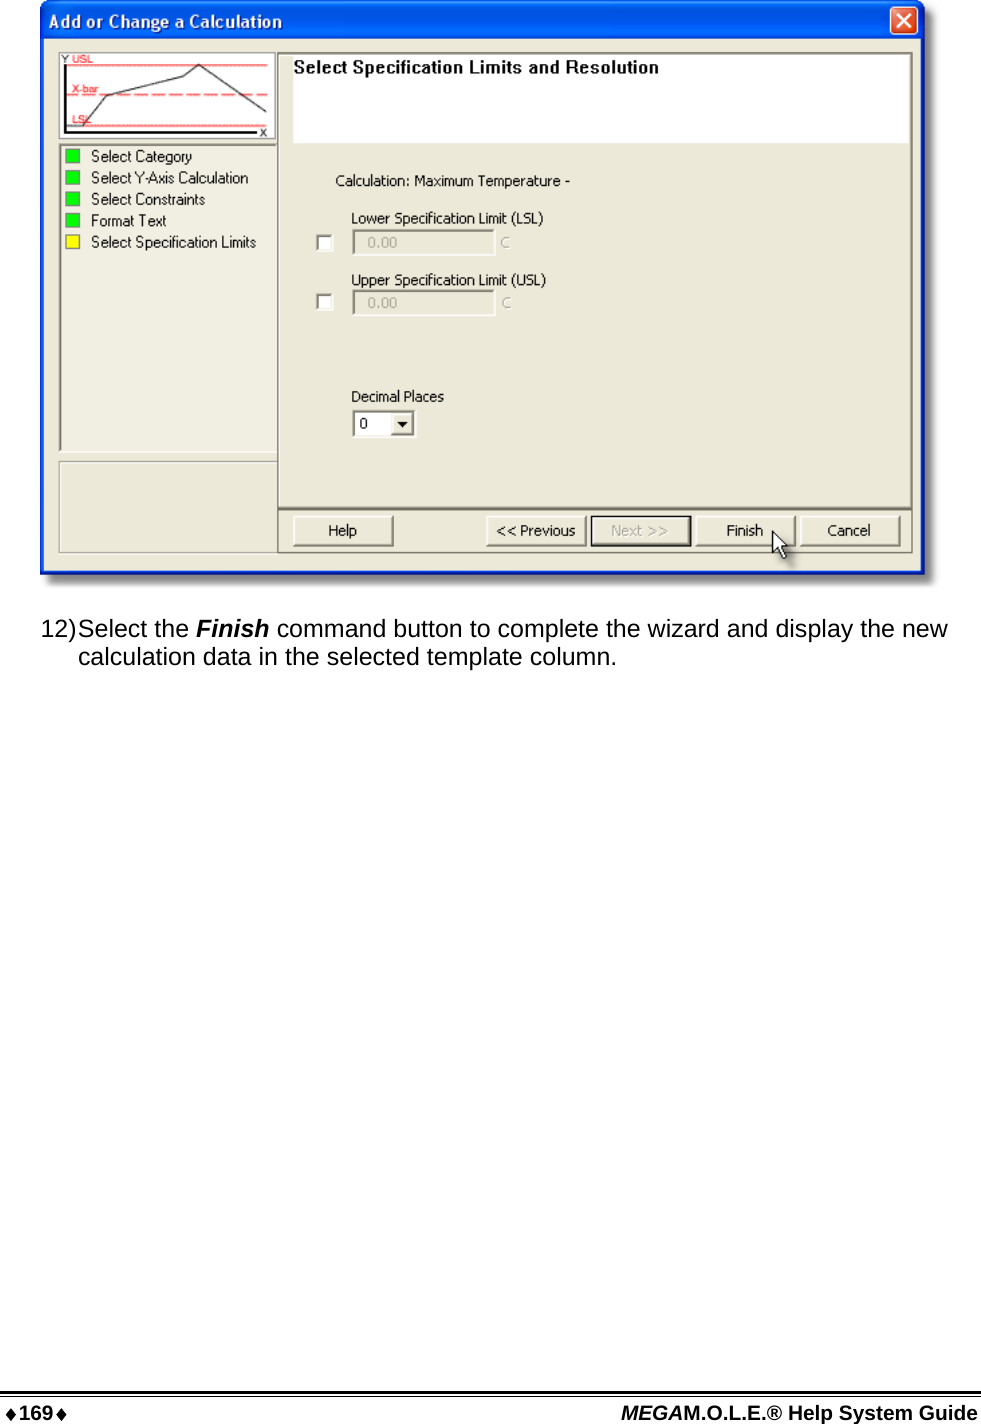
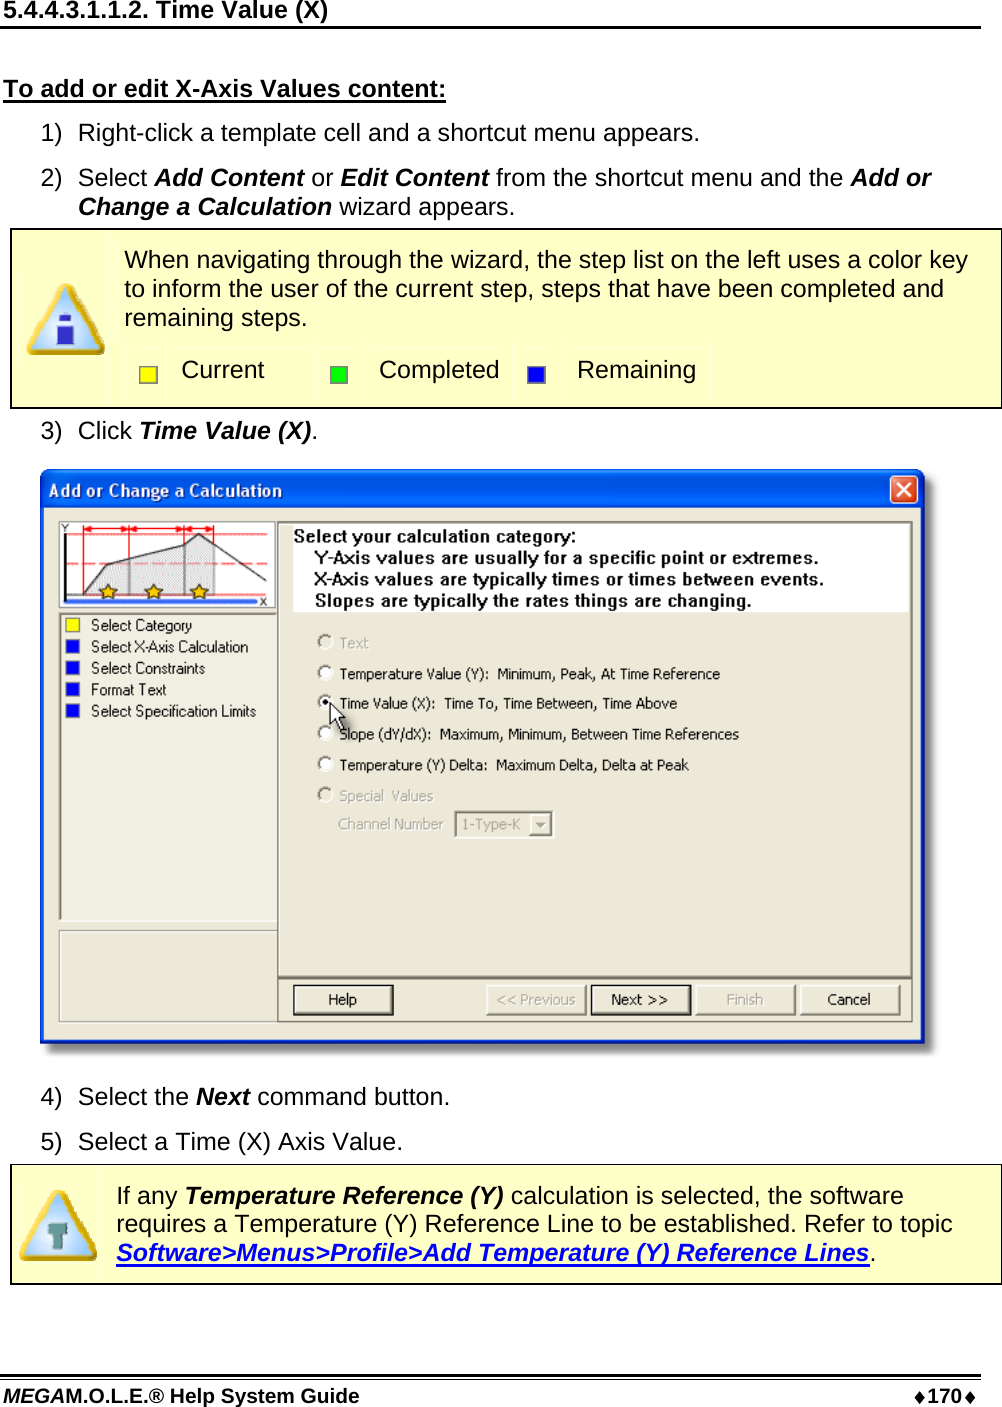
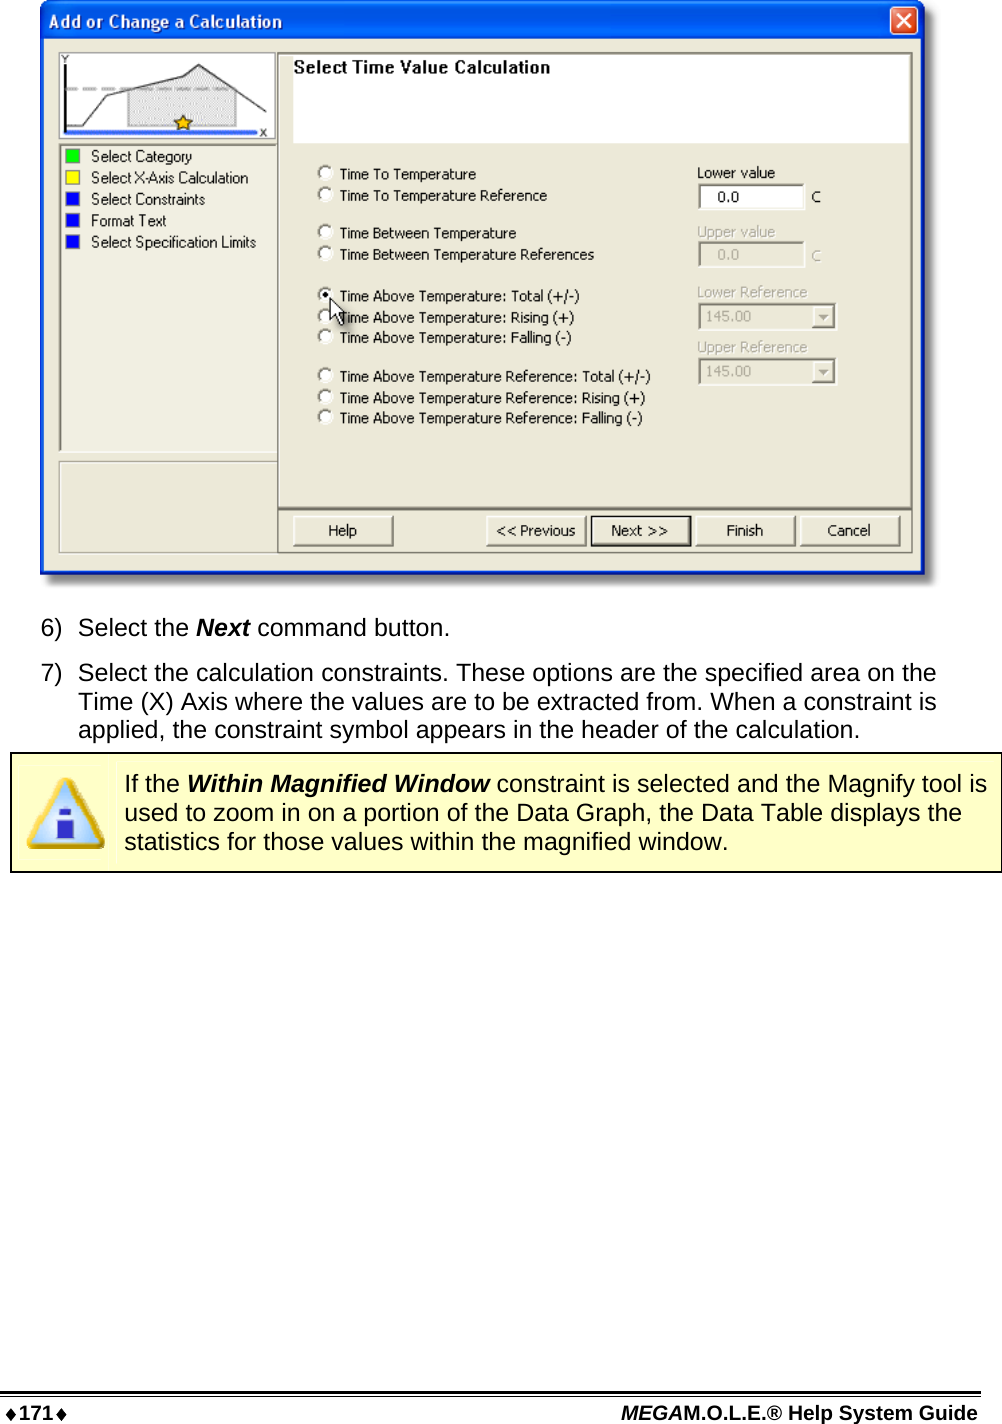


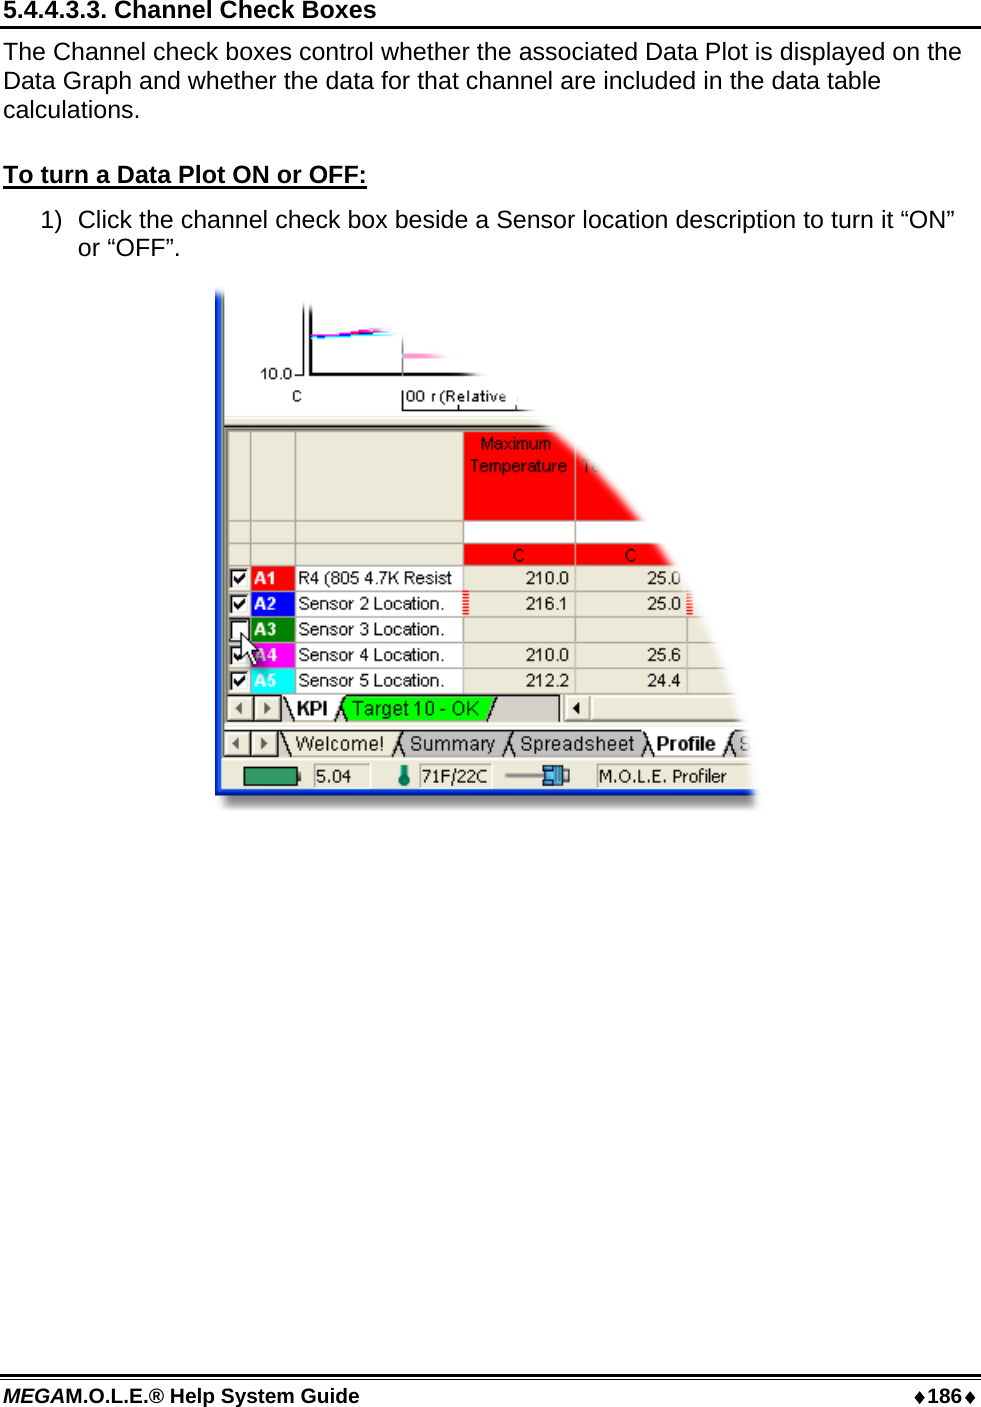
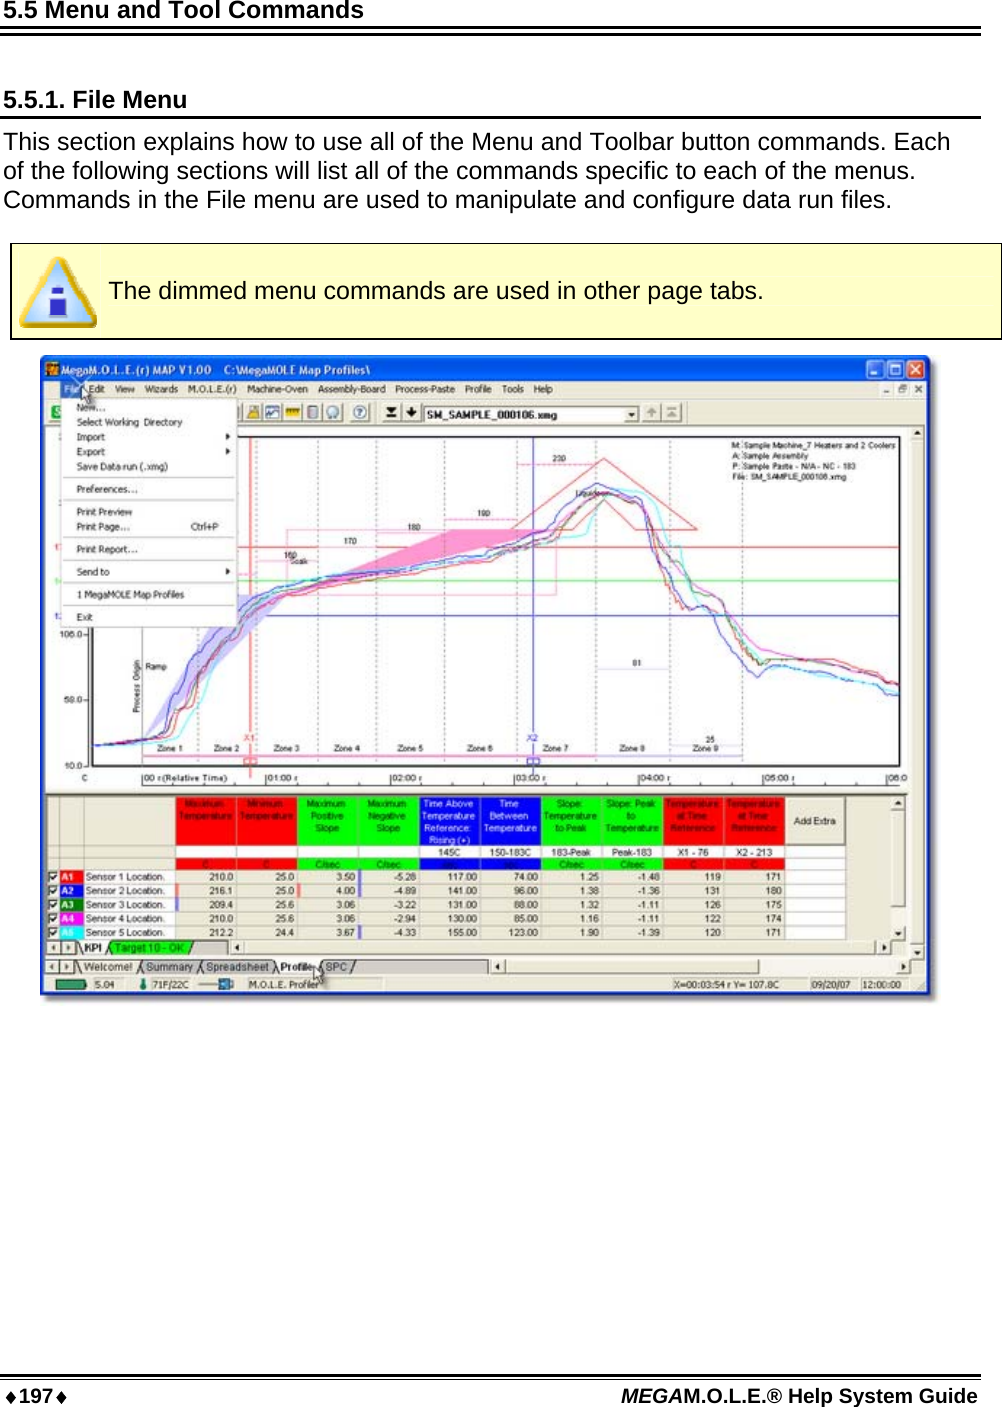
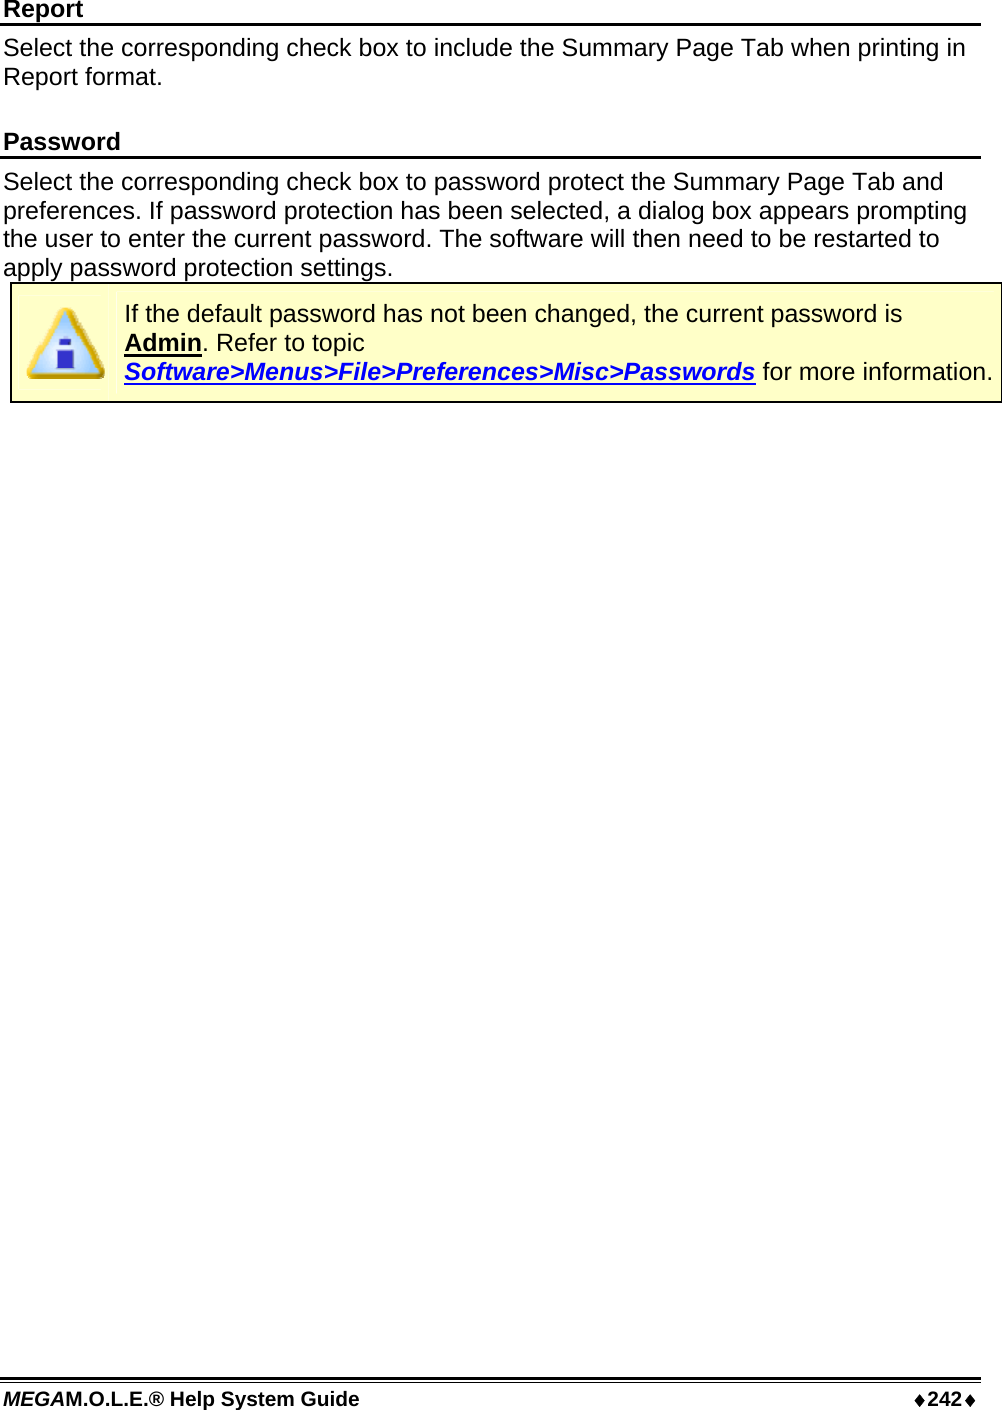
![♦185♦ MEGAM.O.L.E.® Help System Guide 5.4.4.3.2. Sensor Locations The user can use the Sensor Location cells in the Data Table to describe the location where each sensor is connected to the test product. The color and description indicates which Data Plot on the Data Graph it represents. To change a Sensor location description: 1) Click a Sensor Location cell and type the desired name and press the [enter] key. The Sensor Location description can also be accessed by using the Set Assembly Information command in the Assembly menu.](https://usermanual.wiki/Electronic-Controls-Design/E47-6342-45.User-Manual-part-2/User-Guide-937650-Page-61.png)